I just realize I am still paying for this site domain, and I should keep it going.
I’ve been doing a lot of GeoAI, remote sensing imagery processing, open-source or open sauced machine and deep learning tool development at Development Seed. I got inspired on a daily base here and would love to record and write more work kinds of stuff.
I’ve been painting a lot too. I also went to attend many local art shows in the past two years. I sold a couple of my paintings and donated all the money to a friend’s free English program in Cambodia.
I’ve still been climbing a little but I’m not super motivated since I’ve been plateaued for a long term. I may need to do some aggressive training programs. Nay, let’s not do go that route yet.
I may come back here to write more about geo & satellite machine learning and art things. Let’s narrow down to ” ART <> MAP, and anything between”, probably I will plug-in climbing here occasionally ;-). Stay warm!
This is Chinese version, if you have not seen the blog (in English) yet, go here: https://developmentseed.org/blog/2018/01/11/label-maker/
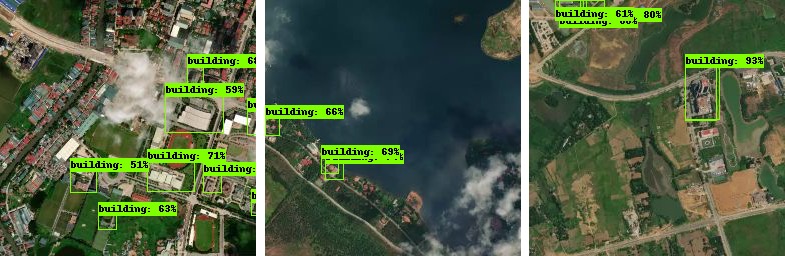
Label Maker is a python library to help in extracting insight from satellite imagery. Label Maker creates machine-learning-ready training data for most popular ML frameworks, including Keras, TensorFlow, and MXNet. It pulls data from OpenStreetMap and combines that with imagery sources like Mapbox or Digital Globe to create a single file for use in training machine learning algorithms.
# the data, shuffled and split between train and test sets
npz = np.load('data.npz')
x_train = npz['x_train']
y_train = npz['y_train']
x_test = npz['x_test']
y_test = npz['y_test']

# define your model here, example usage in Keras
model = Sequential()
# ...
model.compile(...)

# train
model.fit(x_train, y_train, batch_size=16, epochs=50)
model.evaluate(x_test, y_test, batch_size=16)
I’ve stumbled on different sorts of problems while working with geospatial data on the cloud machine. AWS EC2 and Ubuntu sometimes require different setups. This is a quick note for installing GDAL on Ubuntu and how to transfer data from your local machine to your cloud machine without using S3.
To install GDAL
sudo -i
sudo add-apt-repository -y ppa:ubuntugis/ubuntugis-unstable
sudo apt update
sudo apt upgrade # if you already have gdal 1.11 installed
sudo apt install gdal-bin python-gdal python3-gdal # if you don't have gdal 1.11 already installed
To transfer data (SFTP) from your local machine to AWS EC2, you could use FileZilla.
If you are interested in learning more about the tools, we have:
Geolambda that you can run few docker containers that provided to run geospatial analysis on the cloud;
If you are interested in applying machine learning to satellite imagery, we have a few tools: 1)Label Maker for training dataset generation; 2) looking-glass for building footprint segmentation; and 3) Pixel-Decoderfor road network detection and segmentation.
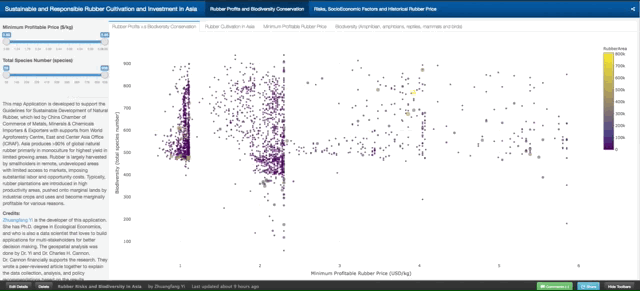
Please go ahead and play with the full-screen map here.
This map Application is developed to support the Guidelines for Sustainable Development of Natural Rubber, which led by China Chamber of Commerce of Metals, Minerals & Chemicals Importers & Exporters with supports from World Agroforestry Centre, East and Center Asia Office (ICRAF). Asia produces >90% of global natural rubber primarily in monoculture for highest yield in limited growing areas. Rubber is largely harvested by smallholders in remote, undeveloped areas with limited access to markets, imposing substantial labor and opportunity costs. Typically, rubber plantations are introduced in high productivity areas, pushed onto marginal lands by industrial crops and uses and become marginally profitable for various reasons.
Fig. 1. Rubber plantations in tropical Asia. It brings good fortune for millions of smallholder rubber farmers, but it also causes negative ecological and environmental damages.
图1:亚洲热带橡胶种植园。它给数以万计的小橡胶农民带来收入,但它也造成了负面的生态和环境的破坏。
The online map tool is developed for smallholder rubber farmers, foreign and domestic natural rubber investors as well as different level of governments.
The online map tool entitled “Sustainable and Responsible Rubber Cultivation and Investment in Asia”, and it includes two main sections: “Rubber Profits and Biodiversity Conservation” and “Risks, SocioEconomic Factors, and Historical Rubber Price”.
This graph tells the correlation between “Minimum Profitable Rubber (USD/kg)” (the x-axis of the graph, and “Biodiversity (total species number)” in 2736 county that planted natural rubber trees in eight countries in tropical Asia. There are 4312 counties in total, and in this map tool, we only present county that has the natural rubber cultivated.
Fig. 3. How to read and use the data from the first graph. Each dot/circle represents a county, the color, and size of it indicates the area of natural rubber are planted. When you move your mouse closer to the dot, you will see “(2.34, 552) 400000 ha @ Xishuangbanna, China”, 2.34 is the minimum profitable rubber price (USD/kg), 552 is the total wildlife species including amphibians, reptiles, mammals, and birds. “400000 ha” is the total area of planted natural rubber plantation from satellite images between 2010 and 2013. “@ Xishuangbanna, China” is the geolocation of the county.
Don’t be shy, please go ahead and play with the full-screen map here. The minimum profitable rubber price is the market price for national standard dry rubber products that would help you to start makes profits. For example, if the market price of natural rubber is 2.0 USD/kg in the county your rubber plantation located, but your minimum profitable rubber price is 2.5 USD/kg means you will lose money by just producing rubber products. However, if your minimum profitable rubber price is 1.5 USD/kg means you will still make about 0.5 USD/kg profit from your plantation.
The county that has a lower minimum profitable price for natural rubber is generally going to make better rubber profit in the global natural rubber market. However, as scientists behind this research, we hope that when you rush to invest and plant rubber in a certain county, please also think about other risks, e.g. biodiversity loss, topographic, tropical storm, frost as well as drought risks. They are going to be shown later in this demonstration.
Fig. 4. The first map is the “Rubber Cultivation Area”, which shows the each county that has rubber trees from low to high in colors from yellow to red. The second map “Minimum Profitable Rubber Price”(USD/kg), again the higher the minimum profitable price is the fewer rubber profits that farmers and investors are going to receive. The third map is ” Biodiversity (Amphibians, Reptiles, Mammals, and Birds)”, data was aggregated from IUCN-Redlist and BirdLife International.
We also demonstrated different types of risks that investors and smallholder farmers would face when they invest and plant rubber trees. Rubber tree doesn’t produce rubber latex before 7 years old, and the tree owners won’t make any profit until the tree is around 10 years old in general. In this section, we presented “Topographic Risk”, ” Tropical Storm”, “Drought Risk”, and “Frost Risk”.
Fig. 5. Section 2 ” Risks, SocioEconomic Factors and Historical Rubber Price” has seven different theme maps and interactive graphs. They are “Topographic Risk”, ” Tropical Storm”, “Drought Risk”, and “Frost Risk”, “Average Natural Rubber Yield (kg/ha.year)”, “Minimum Wage for the 8 Countries (USD/day)”, and ” 10 years Rubber price”.
Dr. Chuck Cannon and I are wrapping up a peer-reviewed journal article to explain the data collection, analysis, and policy recommendations based on the results, and we will share the link to the article once it’s available. Dr. Xu Jianchu and Su Yufang have shaped and provided guidance to shape the online map tool development. We could not gather the datasets and put insights to see how we could cultivate, manage, and invest in natural rubber responsibly without other scientists and researchers study and contribute to field for years. We appreciated Wildlife Conservation Society, many other NGOs and national department of rubber research in Thailand and Cambodia for their supports during our field investigation in 2015 and 2016.
Spark is a platform/environment to allow us to stream and parallel computing big data way faster. There are tons of resources and reading you would do to know more about Spark, so I will just dive into the installation and simple code for running pyspark on counting and sorting words from a book. Basically, just get to know what the keywords or most frequent words for a book.
I wanna use pyspark on my local machine OSX. Pyspark is a library that marriage between python and spark.
To install Pyspark, you could just ‘pip install pyspark’, but you have to install Java first. Go here to see the full detail of pyspark installation.
After pip-install, I ran into an error said “No Java runtime present, requesting install.”. If you encounter the same error, you could refer to this stackoverflow post. I basically added “export JAVA_HOME=”/Library/Internet Plug-Ins/JavaAppletPlugin.plugin/Contents/Home” on my mac terminal. It solved the error and I was able to run spark on my computer.
import re
from pyspark import SparkConf, SparkContext

def normalizeWords(text):
 return re.compile(r'\W+', re.UNICODE).split(text.lower())

conf = SparkConf().setMaster("local").setAppName("WordCount")
sc = SparkContext(conf = conf)

input = sc.textFile("book.txt")
words = input.flatMap(normalizeWords)

wordCounts = words.map(lambda x: (x, 1)).reduceByKey(lambda x, y: x + y)
wordCountsSorted = wordCounts.map(lambda x: (x[1], x[0])).sortByKey()
results = wordCountsSorted.collect()

for result in results:
 count = str(result[0])
 word = result[1].encode('ascii', 'ignore')
 if (word):
 print(word.decode() + ":\t\t" + count)
Re library is a text mining/regular expression in Python, and for other choices, you could use Spacy or NLTK instead of (or together with) Re library too.
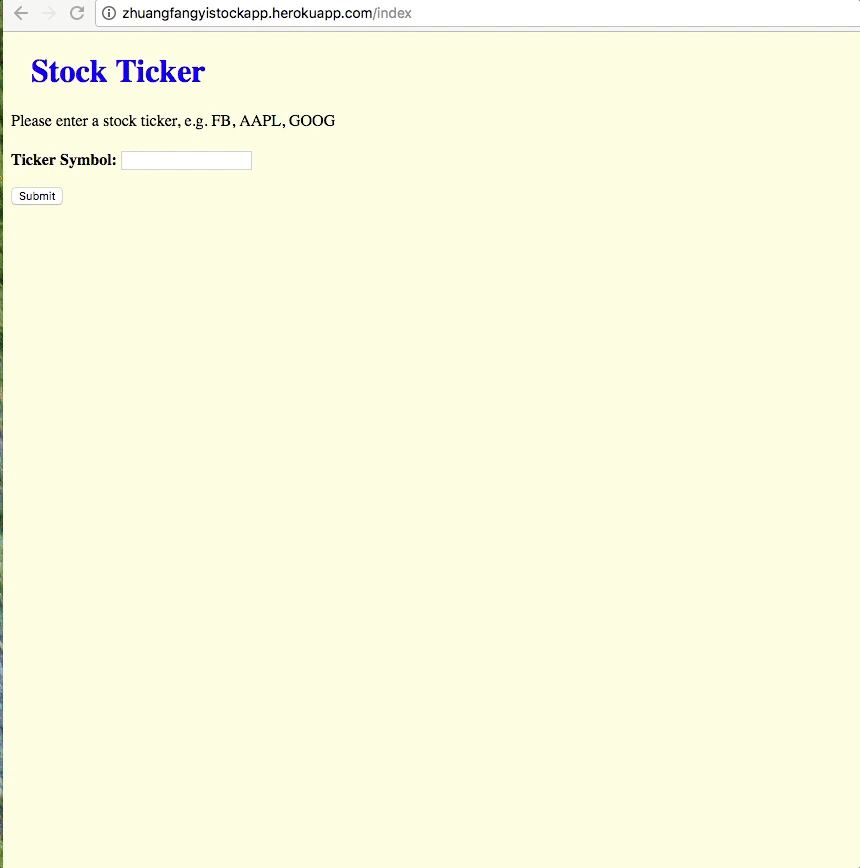
You could search the stock here on my API link: http://zhuangfangyistockapp.herokuapp.com/index
If you’re interested in looking for more ticker symbols for company stock, you could go here.
For example, if you wanna search the ticker code for a company, using “B” instead of Barnes for Barnes Group. It has to be entered an upper case symbol code like the following table:
It’s not a most beautiful and amazing APP, but through hours of coding in Python just make me appreciated how much work and how amazing like Ameritrade is. Making an online data visualization tool is not an easy job, especially when you wanna render data from another sites or database.
To be honest, I would have made a better looking and searching engine with Shiny R in more efficient way, but since this API is my milestone project with The Data Incubator (even before the program is started on Jun. 19, 2017 ), and we are only allowed to use Flask, Bokeh, and Jinja with Python, and deploy the API to Heroku. Here we go, this is the note that would help you or remind me later when I need to develop another API using Python.
First, go to Quandl.com to register an API key, since the API will render data from Quandl.
Second, know how to request Data from Quandl.com. You could render data: 1) using Request library or simplejson to request JSON dataset from Quandl; 2) you could use quandl python library. I requested data using the quandl library because it’s much easy to use.
Third, to develop a Flask framework that could plot dataset from user’s ticker input. See the following Flask framework:
from flask import Flask, render_template,request,redirect
import quandl as Qd
import pandas as pd
import numpy as np
import os
import time
from bokeh.io import curdocfrom bokeh.layouts import row, column, gridplot
from bokeh.models import ColumnDataSource
from bokeh.models.widgets import PreText, Select
from bokeh.plotting import figure, show, output_file
from bokeh.embed import components,file_html
from os.path import dirname, join
app = Flask(__name__)
app.vars={}
###Load data from Quandl
# Here define your dateframe
@app.route("/plot", methods=['GET','POST']) &amp;nbsp; &amp;nbsp;
# Here define the plot you plot.#e.g
def plot():
###### load dataframe and plot it out plot = create_figure(mydata, current_feature_name);
script, div = components(plot)
return render_template('Plot.html', script=script, div=div)
@app.route('/', methods=['GET','POST'])
def main():
return redirect('/plot')
if __name__== "__main__":
app.run(port=33508, debug = True)
Fourth, make your Flask APP worked on your local computer, I mean it should look exactly like above API before I deployed to Heroku.My local API directory and files are organized in this way:
app.py is the main python code that renders data from Quandl, plot the data with Bokeh, and bound it with Flask framework to deploy to Heroku.
Fifth, Push everything above to a Github repository, using Git-CLI command lines:
Two weeks ago, I found out I was ranked at top 2% of all applicants and was selected to join the Data Science Fellowship Program with The Data Incubator (TDI), I was so thrilled. I applied it once around Aug. last year, and only went through the semi-finalist and did not get a chance to go further. I reapplied it again around April this year and found out I was in their semi-finalist again right before Ben and I flew to South Africa to meet our good friends for a rock climbing trip.
Let me give you a bit info about TDI data science fellowship program first. It is “an intensive eight-week bootcamp that prepares the best science and engineering PhDs and Masters to work as data scientists and quants. It identifies Fellows who already have the 90% difficult-to-learn skills and equips them with the last 10%”. The applicant went through three ‘selections’. You apply through their website (here), and the qualified semifinalists are identified by TDI. Then all the semifinalists are in computer programming, math & statistics, and modeling skill test. For this stage, TDI further identifies finalists through semifinalists’ programming, problem-solving skills for real-world problems. As a finalist, you will be interviewed for the data science communication skills with other finalists, and TDI team will decide if you get in the program a week after the interview. About 25% of applicants (~2000 applicants) are selected as semifinalists and 3% are selected as fellows and scholars. See the figure I made bellow (this is only according to the best knowledge I have for the program).
Back to my story ;-). Since we were actually at Rockland, South Africa to start our exciting bouldering journey. I was pretty disappointed about giving up 2 or 3 days out of 8 days of our vacation for the programming, problem-solving test. In addition to that, I have to propose and build an independent data science project. I thought about just postponing or canceling my semifinalist opportunity, and enjoyed the vacation because our wifi was so spotty at the rural South Africa anyway. But I’m glad I did not just give it up. It literally took me 7 or 8 hours in our guest house there to download a 220M dataset from TDI for the test. I was thinking about using my Amazon cloud computer for my independent project, but the internet wasn’t very helpful.
I basically only used the wifi and uploaded my files and answers while everyone left the guest house for their rock climbings, and the best spot for wifi was in our bathroom, lol~~~ uploading a 15M file took me about four hours with multiple fails. LOL…
Luckily, things worked out, and I can’t wait to join TDI’s summer fellow cohort. I’m super excited about learning more advanced machine learning, distributed computing (Spark, Hadoop and MapeReduce) with the smart data brains fellows.
Wish me luck!!!
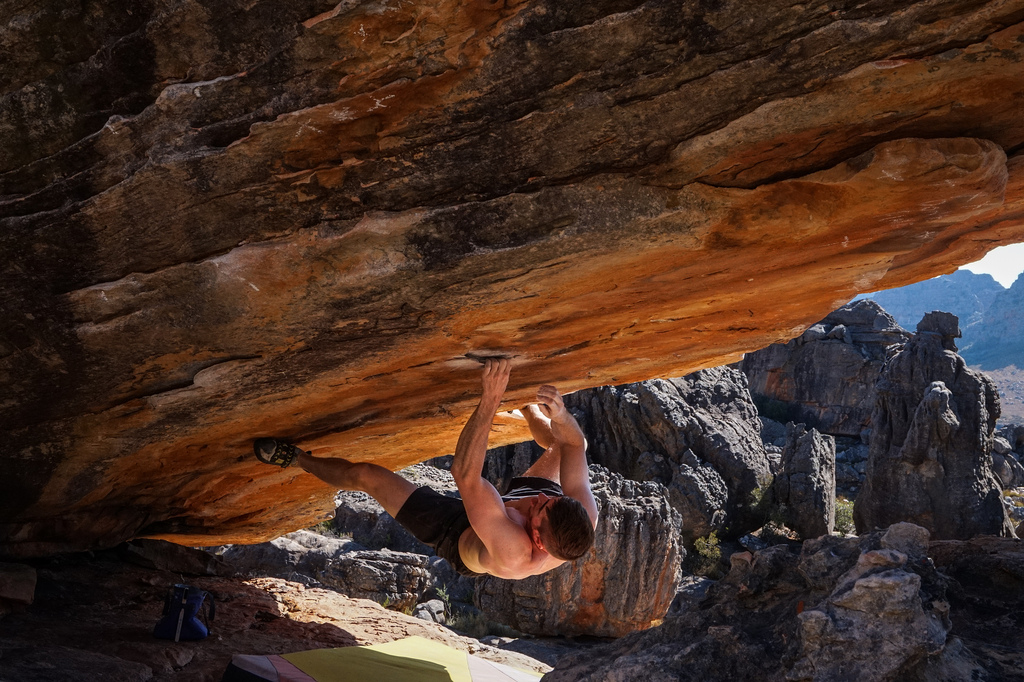
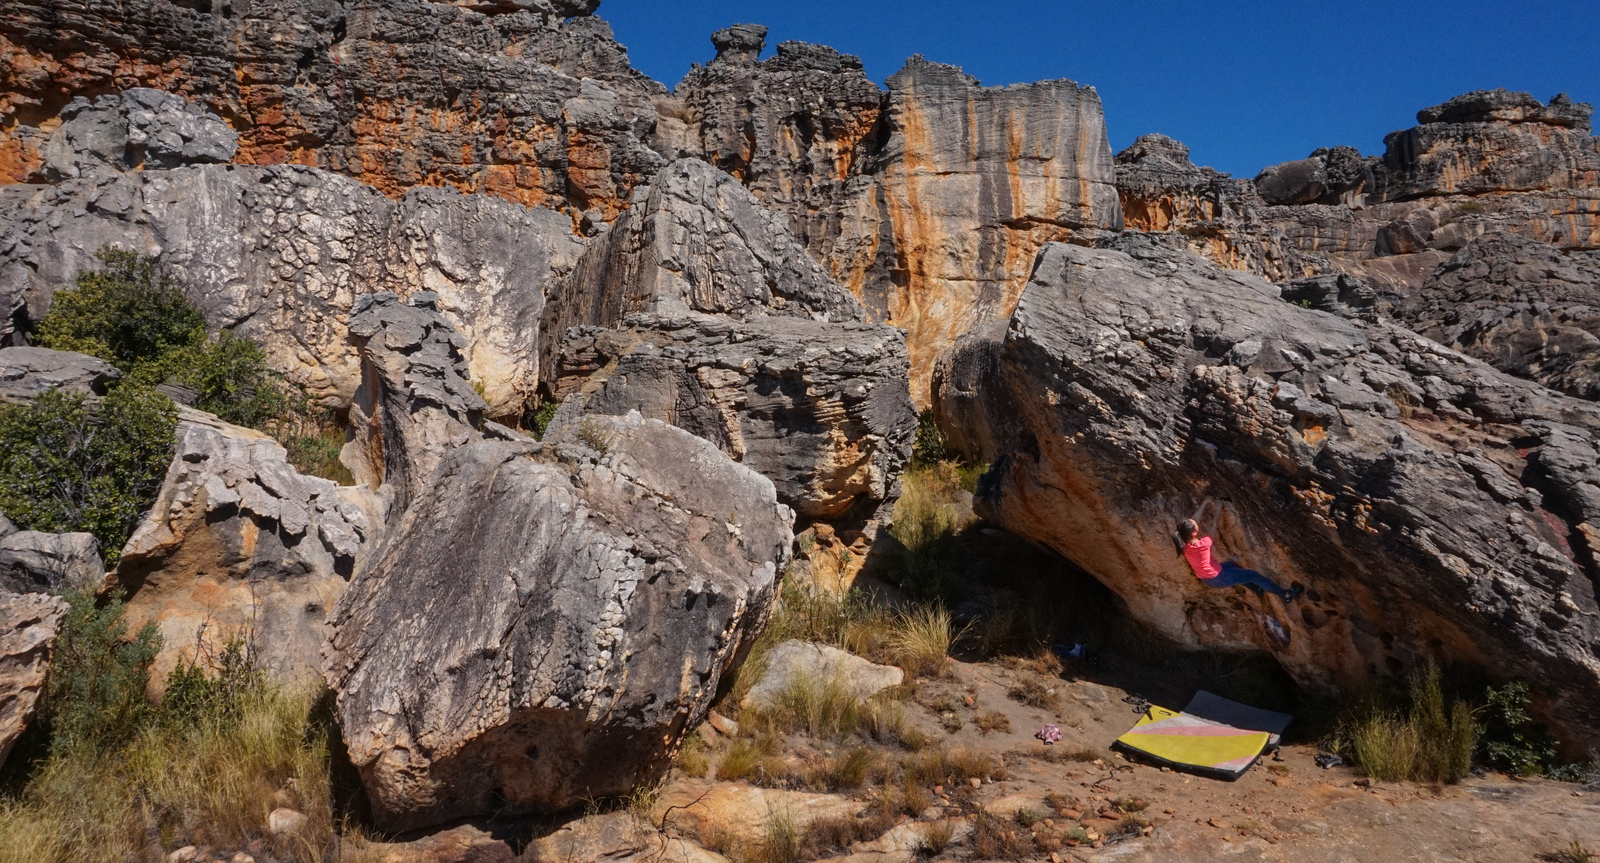
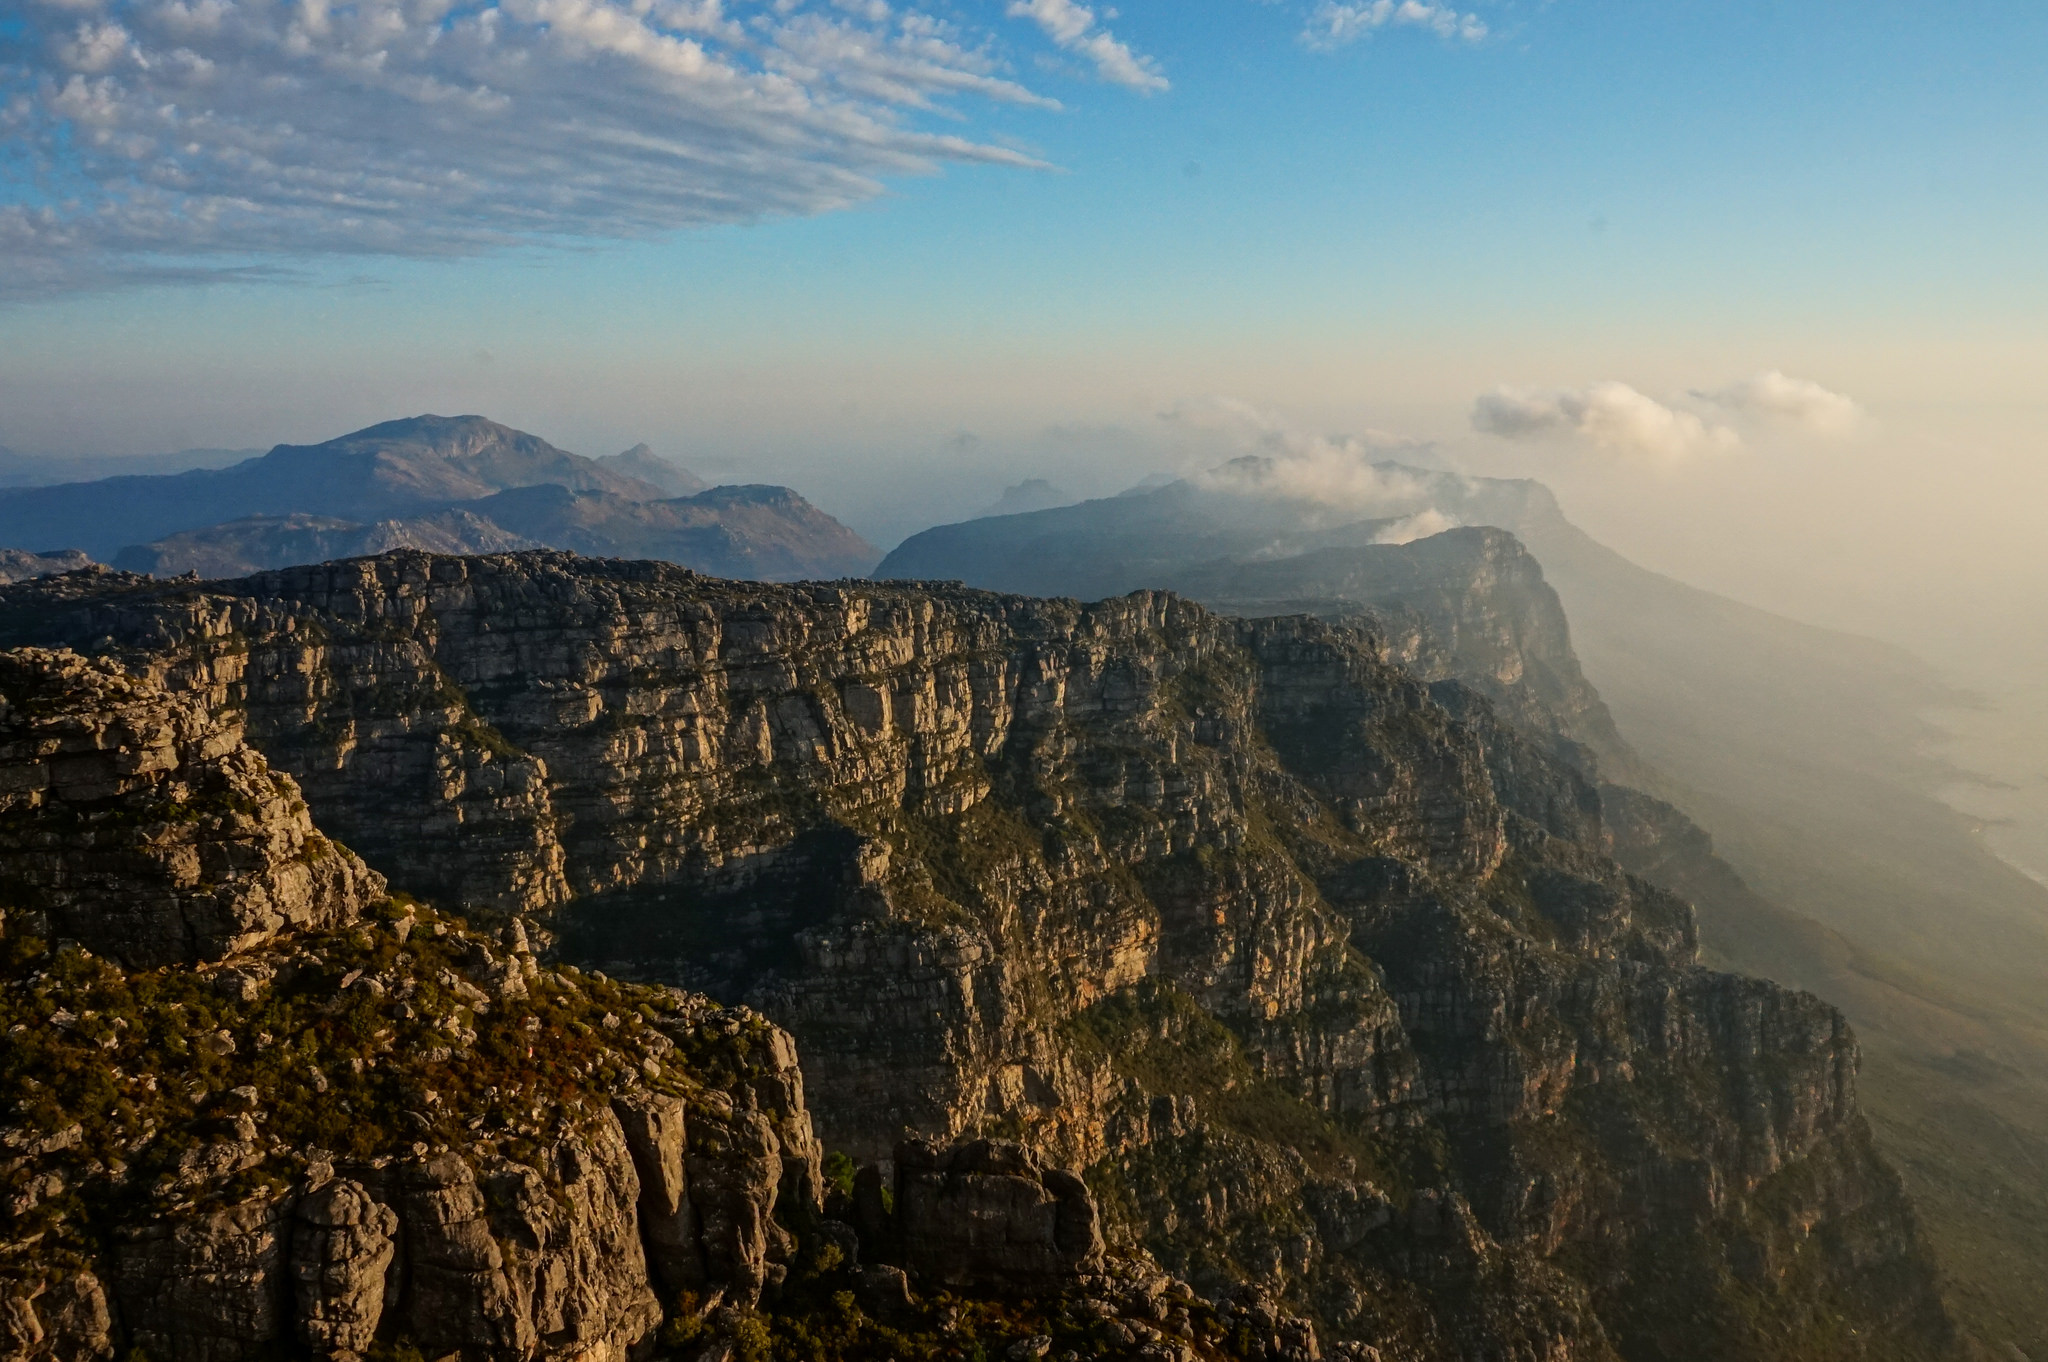
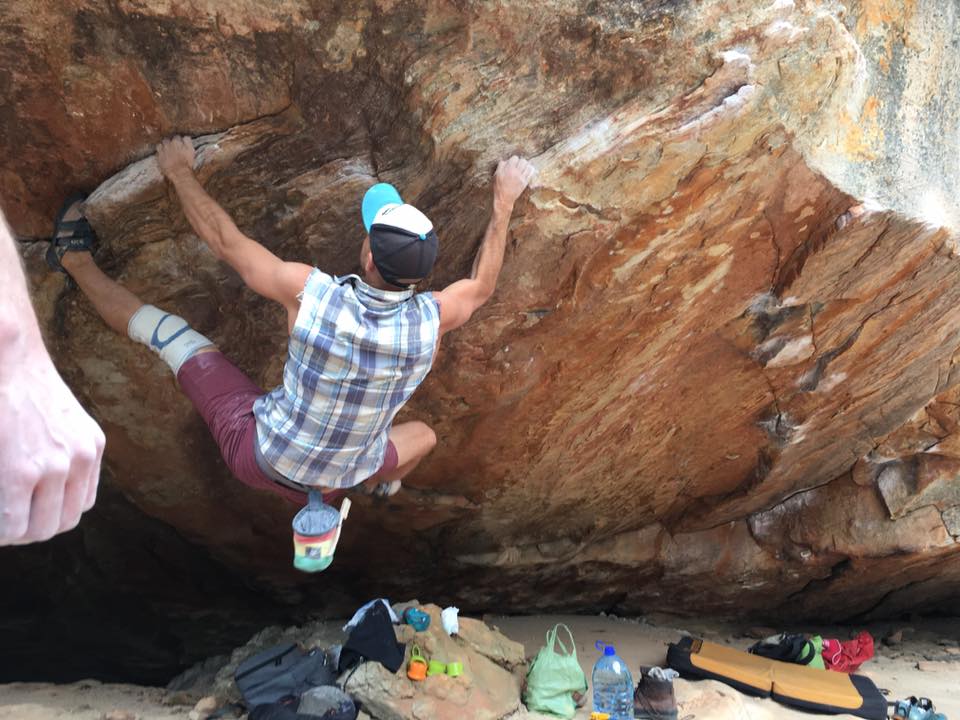
Some pictures of Ben, Pete, me and our other friends’ rock climbing pictures here, and let’s rock through our 2017.
Photo Credits: Ben ;-).
Pete got me(the tiny green bug on the rock ;-)) climbing up a wall at Cape Town local climb.
This basically our best vacation so far, and I am glad I made it through TDI and was able to enjoy the climbing after the test. Our friends Pete and Corlie arranged the whole trip and we’re glad we made all the way to the amazingly beautiful South Africa.
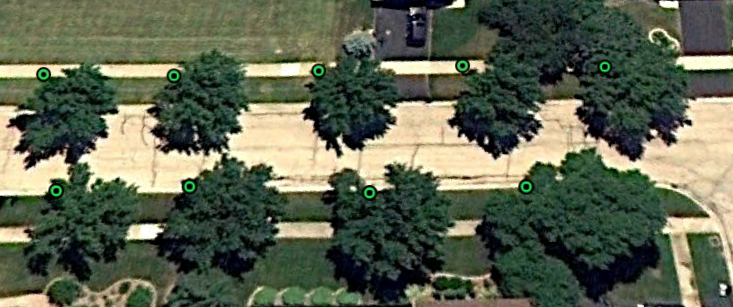
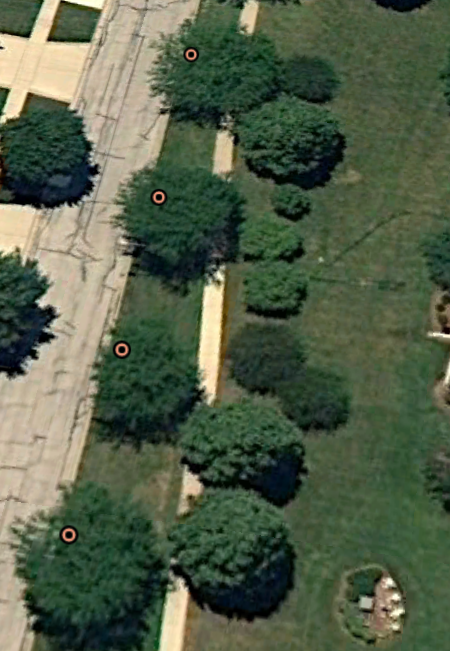
It doesn’t matter which part of the world you are living now, very diverse tree species are planted around the urban area we live. Trees in the urban areas have many functions, for example, trees provide habitats for wildlife, clean air and water, provide significant health and social benefits, and also improve property value too. Wake up in a beautiful morning that birds are singing outside your apartment because you have many beautiful trees grow outside of your space. How awesome is that!
However, tree planting, survey, and species identification require an enormous amount of work that literally took generations and years of inputs and care. What if we could identify tree species from satellite imagery, how much faster and how well we could get tree species identified and also tell their geolocations as well.
A city has its own tree selection and planting plan, but homeowners have their own tree preference, which the identification work a bit complicated, though.
(Photo from Google Earth Pro June 2010 in Chicago area)
It’s hard to tell now how many tree species are planted in above image. But we could (zoom in and) tell these trees actually have a slightly different shape of tree crown, color, and texture. From here I only need to have a valid dataset basically tell me what tree I am looking at now, which is a tree survey and trees geolocation records from the city. I will be able to teach a computer to select similar features for the species I’m interested in identifying.
These are Green Ash trees (I marked as green dots here).
These are Littleleaf Linden, they are marked as orange dots.
Let me run a Caffe deep learning model (it’s one of the neural networks and also known as artificial intelligence model) for an image classification on these two species, and see if the computer could separate these two species from my training and test datasets.
Great news that the model could actually tell the differences between these two species. I run the model for 300 epochs (runs) from learning rate 0.01 to 0.001 on about 200 images for two species. 75% went to train the model and 25% for testing. The result is not bad that we have around 90% of accuracy (orange line) and less than 0.1 loss on the training dataset.
I threw a random test image to the model (a green ash screenshot in this case) and it tells the result.
I will be working on identifying other 20 trees species and their geolocations next time.
Let’s get some answer what trees are planted in Chicago area and how it related to the property value (an interesting question to ask), and also what ecological benefits and functions these tree are providing (leave this to urban ecologist if my cloud computer could identify the species)? Check my future work ;-).
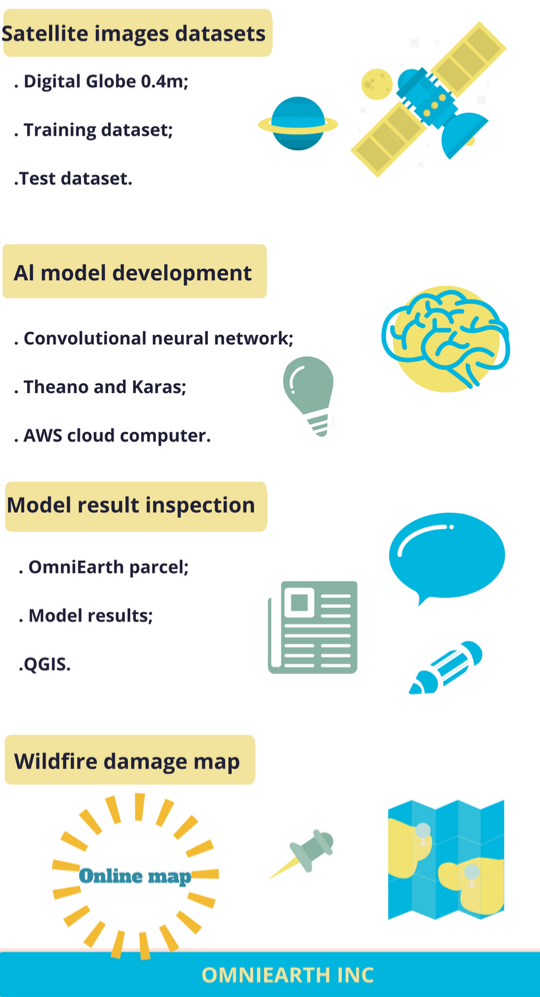
The following work was done by me and Dr. Shay Strong, while I was a data engineer consultant under the supervision of Dr. Strong at OmniEarth Inc. All the work IP rights belong to OmniEarth. Dr Strong is the Chief Data Scientist at OmniEarth Inc.
After obtaining 0.4 m resolution satellite imagery of the wildfire damage in Gatlinburg and Pigeon Forge from Digital Global, OmniEarth Inc created an artificial intelligence (AI) model that was able to assess and identify the property damage due to the wildfire. This AI model will also be able to more rapidly evaluate and identify areas of damage from natural disasters from similar issues in the future.
Fig 1. The final result of fire damage range in TN from our AI model. 该图是通过人工智能模型生成的火灾受灾范围图。
1. Artificial intelligence model behind the wildfire damage火灾模型背后的人工智能
With assistance from increasing cloud computing power and a better understanding of computer vision, more and more AI technology is helping us detect information from trillions of photos we produce daily.计算机图像识别和云计算能力的提升,使得我们能够借助人工智能模型获取数以万计甚至亿计的照片地图等图片中获取有用的信息。
Before diving into the AI model behind the wildfire damage, in this case, we only want to identify the differences between fire-damaged buildings and intact buildings. We have two options: (1), we could spend hours and hours browsing through the satellite images and manually separate the damaged and intact buildings or (2) develop an AI model to automatically identify the damaged area with a tolerable error. For the first option, it would easily take a geospatial technician more than 20 hours to identify the damaged area among the 50,000 acres of satellite imagery. The second option poses a more viable and sustainable solution in that the AI model could automatically identify the damaged area/buildings less than 1 hour over the same area. This is accomplished by image classification in AI, using convolutional neural networks (CNN) specifically, because CNN works better than other neural network algorithms for object detection and recognition from images.
Artificial intelligence/neural networks are a family of machine learning models that are inspired by biological neurons of our human brain. First conceived in the 1960s, but the first breakthrough was Geoffrey Hinton’s work published in the mid-2000s. While our human eyes work like a camera seeing the ‘picture,’ our brain will process it and be able to construct the objects we see through the shape, color, and texture of the objects. The information of “seeing” and “recognition” is passing through our biological neurons from our eyes to our brain. The AI model we created works in a similar way. The imagery is passed through the artificial neural network, and objects that have been taught to the neural network are identified with certain accuracy. In this case, we taught the network to learn the difference between burnt and not-burnt structures in Gatlinburg and Pigeon Forge, TN.
2. How did we build the AI model
We broke down the wildfire damage mapping process into four parts (Fig 1). First, we obtained the 0.4m resolution satellite images from Digital Globe (https://www.digitalglobe.com/). We created a training and a testing dataset of 300 small images chips (as shown in Fig 3, A and B) that contained both burnt and intact buildings, 2/3 of which go to train the AI model, CNN model in this case, and 1/3 of them are for test the model. Ideally, the more training data used to represent the burnt and non-burnt structures are ideal for training the network to understand all the variations and orientations of a burnt building. The sample set of 300 is on the statistically small side, but useful for testing capability and evaluating preliminary performance.
Fig 3(A). A burnt building
Fig3(B). Intact buildings
Our AI model was a CNN model that built upon Theano (GPU backend) (http://deeplearning.net/software/theano/). Theano was created by the Machine Learning group at the University of Montreal, led by Yoshua Bengio, who is one of the pioneers behind artificial neural networks. Theano is a Python library that lets you define and evaluate mathematical expressions with vectors and matrices. As a human, you can imagine our daily decision-making is based on the matrices of perceived information as well, e.g. which car you want to buy. The AI model helps us to identify which image pixels and patterns are fundamentally different between burnt and intact buildings, similar to how people give a different weight or score to the car brand, model, and color they want to buy. Computers are great at calculating matrices, and Theano brings it to next level because it calculates multiple matrices in parallel, and so speeds up the whole calculation tremendously. Theano has no particular neural network built-in, so we use Keras on top of Theano. Keras allows us to build an AI model with a minimalist design on training layers of a neural network and run it more efficiently.
Our AI model was run on AWS EC2 with a g2.2xlarge instance type. We set the learning rate (lr) to 0.01.. A smaller learning rate will force the network to learn more slowly but may also lead to optimal classification convergence, especially in cluttered scenes where a large amount of object confusion can occur. In the end, our AI model with came out with 97% of accuracy, less than 0.3 loss over three runs within a minute, and it took less than 20 minutes to run on our 3.2G satellite images.
Fig 4. (A). using OmniEarth parcel level burnt and intact buildings layout on top of the imagery.
Fig 4 (B). The burnt impact (red color) on top of the Great Smoky Mountains from late Nov. to early Dec 2016.
Satellite image classification is a challenging problem that lies at the crossroads of remote sensing, computer vision, and machine learning. A lot of currently available classification approaches are not suitable to handle high-resolution imagery data with inherent high variability in geometry and collection times. However, OmniEarth is a startup company that is passionate about the business of science and scaling quantifiable solutions to meet the world’s growing need for actionable information.
Contact OmniEarth for more information:
For more detailed information, please contact Dr. Zhuangfang Yi, email: geospatialanalystyi@gmail.com; twitter: geonanayi.
or
Dr. Shay Strong, email: shay.strong@omniearthinc.com; twitter: shaybstrong.
I am back to my blogging life after awhile~ 好久没有写博客,我又回来了!
I’ve been working on image classification and segmentation quite a lot recently, and totally in love with GPU big data processing. If you wanna process data that at gigabyte (G) level data definitely look into start a GPU AWS instance 最近我的工作接触了很多图像分类,和图像分割的内容,感觉自己太爱gpu图像分析的世界:太神速了。如果你现在处理的数据已经达到G级别了,我觉得你还是应该开一个亚马逊的ami(亚马逊的深度学习平台/机器)
It is not free, though. You definitely would start with AWS free tier, but I normally use their g or p machines. For example, if I use g2.2 x large, I will be charged about $0.65 per hour. for more information, go here. It charges by how much you use and if you are new to deep learning and just wanna run some case studies, I think it worths more than building your own GPU machine or buy a new pc with super GPU.
但是话说回来亚马逊的ami其实也不是免费的。我现在用的机器主要两种p和g。比如我现在一般用的是g2.2 x large,价格大概在0.65美金一个小时。更多的选择可以看这里。我觉得这个还是很有吸引力的,如果你只是想要跑几个学习案例的话,我觉得这个ami非常棒。总之还是比现在才在学习阶段,就买台有gpu的电脑或者建自己的gpu机器学习平台有用。
You should definitely do some research on: 在去开个亚马逊深度学习ami之前,我觉得大家该想想:
What do you wanna do with the AWS machine? Do you wanna learn just some basic machine learning stuffs that you only need to process megabyte (?M) level csv/txt data file you could just use your personal computer. A personal computer is fast enough though days. 你想拿这个亚马逊深度学习平台来做什么?如果只是用来处理几兆几十兆的数据的话,那还是没有必要开一个,现在的个人电脑那么快完全可以处理这些数据了。
As I mentioned above, if you wanna process images or data that above some certain level your personal computer could not handle. Think about how much you wanna spend on the data processing. Again, evaluate your situation, needs and do some research. 但是,如果你的数据量已经是在几百兆或者g级别的,当然还是很有必要开一个的。话说回来,还是应该做些调查研究加上考量自己的情况。
My needs for this personal AWS EC2 machine are: 我需要这个亚马逊ami深度学习平台,主要是想用来做:
Processing big data set on neural network image classification and segmentation;图像分类和图像分割;
A machine that has Tensorflow, Theano, Torch, Keras, and also Caffe installed. Tensorflow, Theano, Torch, and Caffe are deep learning ecosystem/environment. Keras is the python module that I use to build deep learning algorithm architecture.想这个ami机器上有我想用的几个深度学习框架,比如Tensorflow, Theano, Torch, and Caffe。还有如果有keras,python的一个构建深度学习/机器学习的包。
If you are thinking about doing the same things, this is a great blog to start your own AWS AMI Instance here or this one. They both have explicit instructions on how to star the instance.
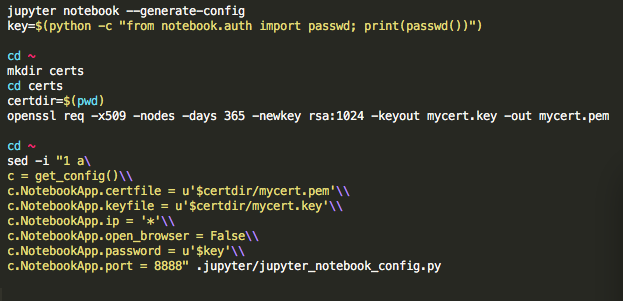
Second options of launching an AWS AMI with a jupyter notebook server without going through all the AWS web console. Using the following command line in your terminal:
Copy and paste the following command lines (CLI) from above figure.
cd ~
mkdir certs cd certs certdir=$(pwd)
openssl req -x509 -nodes -days 365 –newkey rsa:1024 –keyout mycert.key -out mycert.pem
cd ~ sed -i “1 a\ c = get_config()\\ c.NotebookApp.certfile = u’$certdir/mycert.pem’\\ c.NotebookApp.keyfile = u’$certdir/mycert.key’\\ c.NotebookApp.ip = ‘*’\\ c.NotebookApp.open_browser = False\\ c.NotebookApp.password = u’$key’\\ c.NotebookApp.port = 8888″ .jupyter/jupyter_notebook_config.py
These CLI are to create your AWS AMI certificate for Jupyter Notebook server, and then you could run and test out if your jupyter notebook works, after seccessfully run above CLI.
screen -S jupyter
mkdir notebook
cd notebook
jupyter notebook
For more info you could see this blog for details.
If you wanna use Ubuntu AMI instead of Amazon AMI here is another good blog for setting up the jupyter notebook server on the machine