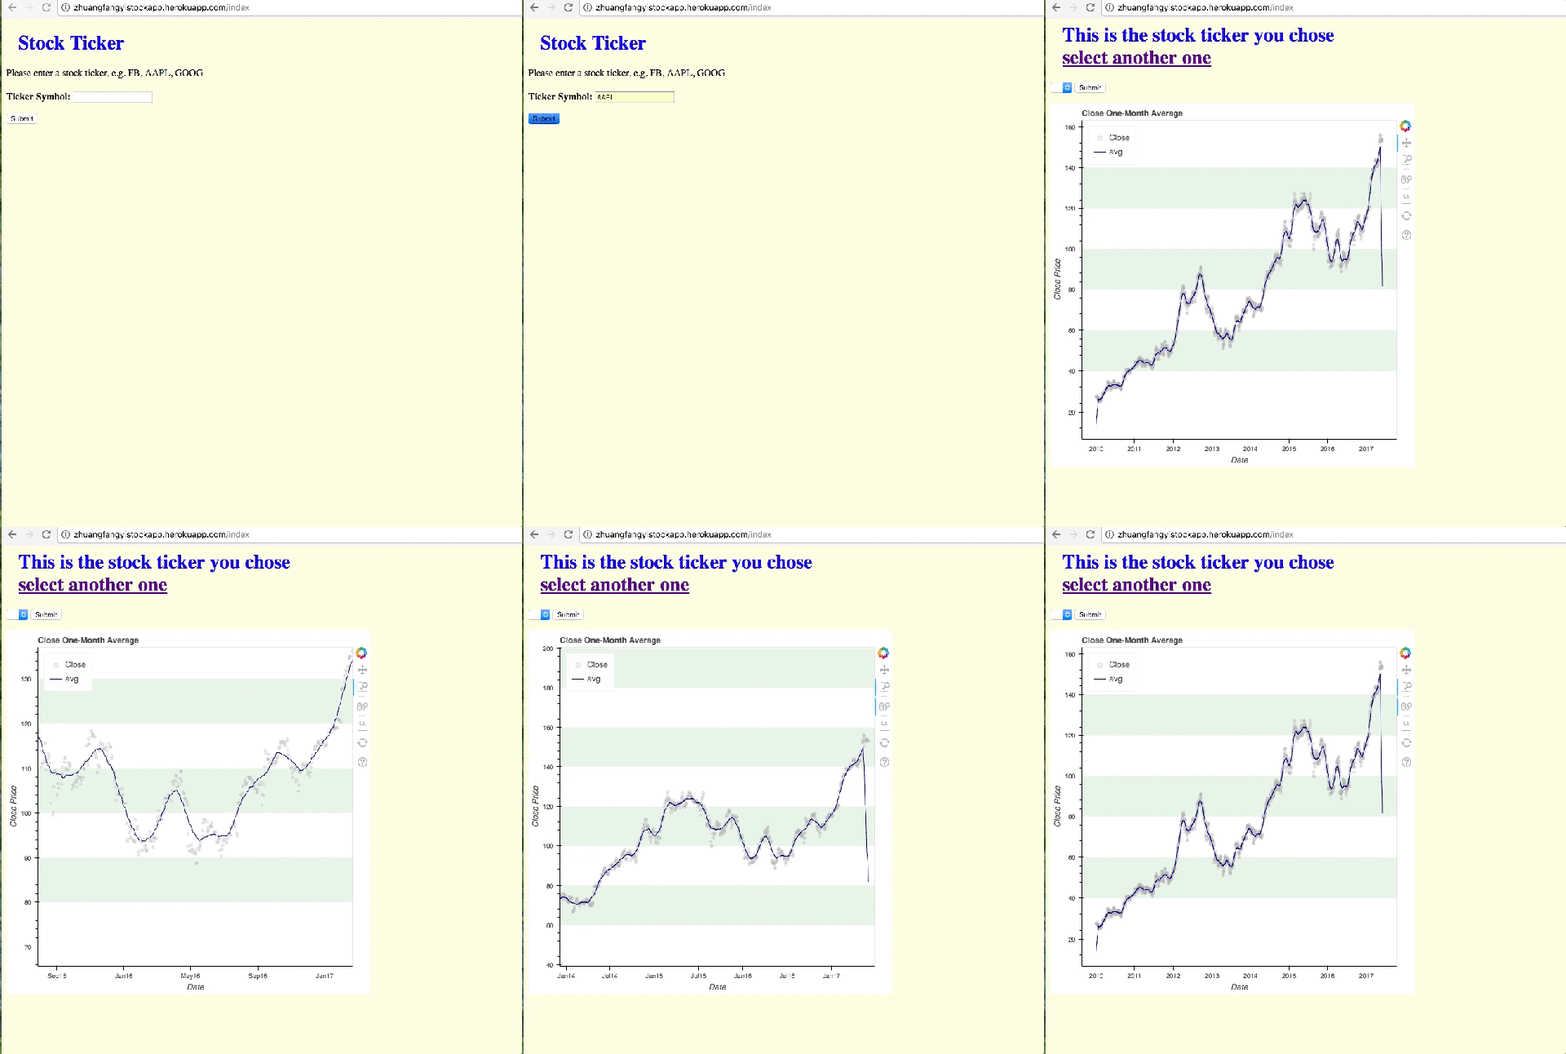
My final API looks like this:

You could search the stock here on my API link: http://zhuangfangyistockapp.herokuapp.com/index
If you’re interested in looking for more ticker symbols for company stock, you could go here.
For example, if you wanna search the ticker code for a company, using “B” instead of Barnes for Barnes Group. It has to be entered an upper case symbol code like the following table:

It’s not a most beautiful and amazing APP, but through hours of coding in Python just make me appreciated how much work and how amazing like Ameritrade is. Making an online data visualization tool is not an easy job, especially when you wanna render data from another sites or database.
To be honest, I would have made a better looking and searching engine with Shiny R in more efficient way, but since this API is my milestone project with The Data Incubator (even before the program is started on Jun. 19, 2017 ), and we are only allowed to use Flask, Bokeh, and Jinja with Python, and deploy the API to Heroku. Here we go, this is the note that would help you or remind me later when I need to develop another API using Python.
First, go to Quandl.com to register an API key, since the API will render data from Quandl.
Second, know how to request Data from Quandl.com. You could render data: 1) using Request library or simplejson to request JSON dataset from Quandl; 2) you could use quandl python library. I requested data using the quandl library because it’s much easy to use.
Third, to develop a Flask framework that could plot dataset from user’s ticker input. See the following Flask framework:
from flask import Flask, render_template,request,redirect
import quandl as Qd
import pandas as pd
import numpy as np
import os
import time
from bokeh.io import curdocfrom bokeh.layouts import row, column, gridplot
from bokeh.models import ColumnDataSource
from bokeh.models.widgets import PreText, Select
from bokeh.plotting import figure, show, output_file
from bokeh.embed import components,file_html
from os.path import dirname, join
app = Flask(__name__)
app.vars={}
###Load data from Quandl
# Here define your dateframe
@app.route("/plot", methods=['GET','POST'])
# Here define the plot you plot.#e.g
def plot():
###### load dataframe and plot it out plot = create_figure(mydata, current_feature_name);
script, div = components(plot)
return render_template('Plot.html', script=script, div=div)

@app.route('/', methods=['GET','POST'])
def main():
return redirect('/plot')
if __name__== "__main__":
app.run(port=33508, debug = True)
Fourth, make your Flask APP worked on your local computer, I mean it should look exactly like above API before I deployed to Heroku.My local API directory and files are organized in this way:

app.py is the main python code that renders data from Quandl, plot the data with Bokeh, and bound it with Flask framework to deploy to Heroku.
Fifth, Push everything above to a Github repository, using Git-CLI command lines:
git init
git add .
git commit -m 'initial commit'
heroku login
heroku create ###Name of you app/web
git push heroku master
The last but not the least, in case you wanna edit your Python code or other files to update your Heroku API. You could again do:
###update heroku app from github
heroku login
heroku git:clone -a <your app name>
cd <your app name>
#make changes here and then follow next step to push the changes to heroku
git remote add <your git repository name> https://github.com/<your git username>/<your git repository name>
git git fetch <your git repository name> master
git reset --hard <your git repository name>/master
git push heroku master --force
Other reads might be helpful here:
