My web map application is online

Hi friends,

I’ve been working on a web application for Chinese Ministry of Commerce on rubber cultivation and risks will be out soon, and I just wanna share with you the simplified version web map API here. I only have layers here, though, more to come.

Screen shot for web map application

Web map application by Zhuangfang Yi: Current rubber cultivation area (ha) in tropical Asia

This web map API aims to tell the investors that rubber cultivation is not just about clearing the land/forests, plant trees and then you could wait for tapping the tree and sell the latex. There are way more risks for the planting/cultivate rubber trees, including several natural disasters, cultural and economic conflicts between the foreign investors and host countries.

We also found the minimum price for rubber latex for livelihood sustainability is as high as 3USD/kg. I define the  minimum price is the price that an investor/household could cover the costs of establishing and managing their rubber plantations. While the actual rubber price is lower than the minimum price, there is no profit for having the rubber plantations. The minimum price for running a rubber plantation varies from country to country. I ran the analysis through 8 countries in Asia: China, Laos, Myanmar, Cambodia, Vietnam, Malaysia and Indonesia. The minimum price depends on the minimum wage, labour availability, costs of the plantation establishments and management, average rubber latex productivity throughout the life span of rubber trees. The cut-off price ranges from 1.2USD/kg to 3.6USD/kg.

We could make an example that if rubber price is 2USD/kg now in the market, the country whose cutoff price for rubber is 3USD/kg won’t make any profit, but the investors in the country might lose at least 1USD/kg for selling every kg of rubber latex.


location, location, more locations: location intelligence and geocoding for growing the business

I’ve been browsing through the job broads too much recently. Yes, TOO MUCH, which makes me so anxious and angry sometimes. The employers out there just wanna you to do everything. Only the GIS job kinda things I am really interested in now, the employers want me to use ArcGIS for years, know all the spatial analysis/statistics, and also know open source data sources, and different satellite images processing—OK, I could do that. But I also need to be able to code via C++, Python, Jave, CSS and HTML, AND if I know the popular statistical and mathematical tools, like SAS, STAT, R, or MATLAB is plus. What about you could also use Adobe illustrator to make the most awesome maps and you better speak second and third foreign languages. The essential duties for the job position are …. a list of 20 duties, and requirements… another 30 of them and additionally… you must have xxx years of social, economic and environmental science related work experiences in Africa, Asia and South America…. I get it, I am never gonna be a good candidate. But, employers out there, come on… you don’t need a technical slaver, or Mr./Ms-knows-everything, you need the employee who can learn and wanna learn, and who can really evolve with your business and passionate about the job you give to them. When the employers refuse to give you the job offers that they are also so confident that they are gonna find someone right fit the position very soon, which terrified me the most. YOU ARE NOT THE BEST— that is the message I got everyday while I’m browsing through the job boards!

Back to the location intelligence. Business people, enterprise and industries leaders out there have grown their interests on analyzing your shopping behavior, habits and locations. Yes, it all about us. U.S Census bureau has launched two programs about the location analysis/intelligence for small business people who wanna start they own business, one is called country business pattern and another one is ZIP code business pattern.It aims to help small business people. The data are from 1998 to 2013, I never have a chance to use them but it could be super cool to dig out the information and pattern through the data. Future business starters would need more and more of this kinda information. From my own opinion is that: firstly, the business pattern would help you to analyze or map out the similar business you wanna run out there in your town, county or even nationally; secondly, the ZIP code business pattern could do the similar thing like business pattern analysis , but the ZIP code could also be used to analyze your potential customers’ behavior, race and so on, which means just map out your potential customers largely; the last step could be the real location analysis/intelligence, which would help you to analyse where is the best location to build/start your business, to avoid the potential business competitors but target to a bigger group of future customers. It’s certainly a mixing of information science, spatial analysis, statistics….

I only know about the ZIP code/geocoding so far, but it’s way too cool, and just wanna make a little note to myself in this blog. For an example you could go back to see my first blog in this blog site. The main process for matching the addresses/ZIP codes is: 1) Build/obtain reference data, which could be points, e.g. cities, counties, nations, or houses; polyline, e.g. streets, roads, and polygons, e.g. independent house, business centers; 2) Select address locator style, they are US Address-Dual Ranges, One Range, Single House, Street Name, City States, ZIP 5 Digit, ZIP +4, General-City State Country, General- Gazetteer, General-Field; 3) Build address locator, and then 4) Perform address matching. ArcGIS geocoding could do process this for you, and you could just run the geocoding through it. In the spatial analysis, besides the locations, the scale of your interest in are very important, for example, independent house and shopping mall are polygon in bigger spatial scale but they become points when you zoom out to a smaller scale.

location map

Creating interactive maps inside existing business systems can help users see patterns that graphs and charts cannot reveal. (ESRI)

Reference for the blog content except the complaining at the beginning and my own thought:

  1. location analysis for business from ESRI;
  2. Geocoding on WIKI ;
  3. Business pattern analysis data from U.S. Census;
  4. Business strength geocoding;

Why it has to be an ESRI certification?

After I signed up an ESRI ArcGIS certification exam, I felt regret immediately. It just sounds a bit  stupid that whoever wanna be certified that how good and efficient of they could use a software (platform), even though people do that all the time. As some of you might know that I just moved to the states from China and recently have been looking for a job as a geospatial analyst. Every single job that I wanna apply have a sentence directs to ESRI and ArcGIS skillets e.g. “GIS-related applications including…… ESRI ArcGIS Online, and ArcGIS Suite (ArcMap, ArcSDE, ArcCatalog, etc.”. That’s the initial reason I signed up for the certification exam from ESRI, if I could think of one. Of course I am also very curious that why people are so obsessed with ESRI since there are several alternative tools out there could get spatial analysis done.  Don’t get me wrong that I’ve been using ESRI products for years, and I think they are super powerful, only thing I really need is showing the proof that I could do the spatial analysis to the future employer.
I am just trying to think one or two things might explain why I need a certification and why it has to be from ESRI. Firstly, why we need a certification on GIS:
  1. Geospatial technology is a growing industry itself, and a lot of employers need to identify the future employees who claim they got the skill-sets they want;
  2. There are no a really good certification that could be pursued in the geo-industry standard really, and GISP sounds supper high-ends that only 7000 people have it and 5000 of them are in the states. For whom are in the field and wanna take the exam, Geographic Information System Certification Institute (GISCI) just announced a GIS profession certificate exam several days ago: http://www.directionsmag.com/pressreleases/gisci-announces-exam-application-period/454179.
These two reasons are what I could think about why I need a GIS certification to certify people who have the skill sets. But why it has to be the ESRI certifications. I’ve been asking around that why in GIS professional groups. I posted a question on GIS group to ask people “if having a certification from ESRI would really help me find a job in the states”. There were no direct question for it, if you’re interested in seeing how people responded to that you could go to: https://www.linkedin.com/grp/post/49657-6042661347865489408. To answer that why it has to be ESRI certification:
  1. ESRI has included the dominated geospatial skill-sets that an industry/company could asks for, from very basic desktop analysis skills to enterprise big data analysis;
  2. ESRI has a 43% of share in GIS market, and the second-largest supplier share 11%, which tells that ESRI is leading the geospatial Market; They are keeping the core GIS coming from many talented employees, and ESRI’s core GIS is used by more than two-third of Fortune 500 companies;
  3. ESRI has great educational platform. I mentioned in my last blog post that ESRI is promoting it’s ArcGIS Online, the online campus classes have more than 5000 students participated and the number is growing everyday; Other than that they also have a lot of free online tutorials (some are not) for people from beginner to developer;
  4. The marketing strategy is selling stories rather than fancy technical functions that ESRI ArcGIS could preforms. I am a huge fan of them since I brought 6 big books last year and went through most of them. they are: ESRI ArcGIS Desktop Associate Certification exam book, GIS Tutorial Basic Workbook, GIS Tutorial Spatial Analysis Workbook, GIS Tutorial Advanced Workbook, Python scripting for ArcGIS and The ESRI Guide to GIS Analysis. The real-world problems/stories that provided behind the data and spatial analysis just keep motivating me to try more and learn more. The overall theory behind the problems/stories are very solid, and I feel the hand-on analysis exercises, solving the real world story, really enhance the knowledge and theory I learn.
  5. ESRI also provides some cool blogs, e-magzines, and materials that you could extent the knowledge as a GIS fan.

黎明

You’re welcomed to share any insights here.

More links about my work:

Web GIS is the next big thing in geospatial analysis and why

I bet a lot of you know about google map, and use it very frequently for daily life. Google map is online mapping service that do the calculation, analysis mainly through geocoding. Geocoding is an algorithm that based on location and zip code.  Google provides the awesome products and mapping services like satellite imagery (base map), google earth, street map and 360 panoramic street view, google traffic. You might have noticed that recently google just add biking and flight functions to Google map, and now you could easily estimate the traffic time by bike and flight besides walking, public transportation and driving.  It’s so shame that google products are blocked in China, including google map. Anyway, the only motivation get me writing more blogs about geo-sicence stuffs just because my ideal job for my future career is become a geospatial analyst and cartographer. Google map we’re talking about here, it is already a final product of geospatial analysis. But as a geospatial analyst or GIS specialist, we are looking for pulling different spatial/non-spatial data for another exciting analysis everyday, and finally get people to use and benefit from it.

564B363F-A18A-4555-A292-376C27FD1017

(Ready to use provide by ESRI web map)

I signed up a free online course, on ArcGIS Online, with ESRI three weeks ago, with other 5000 students from different corners of the world. It’s really fascinating to see other 5000+ students, as dots,  popup on a map. How advance the geospatial analysis, computing, and open source spatial datasets have been developed in the states are blowing my mind every day, since I have devoted myself in GIS (Geographic Information system) studying. It’s really a shock, and feel like I am really proud of owning a new bicycle and find all my peers are driving rockets around already. Learning about it and being part of it is just so exciting.
Web maps have been existed for a decade. However, we are far behind back to China. A lot of my colleagues and friends are using ArcGIS 9.3, and in the states that 10.3 has been released for a while ago. It can’t be said that there are 10 generations gap between this two version, but it’s quite a big gap. The gap between two countries are not just the tool, analysis skill but it’s also the spatial datasets. Spatial datasets are not widely available in China, so we have to looking for a cooperation or buy the data from other research institutes and state departments, who are supposed to provide free data for research purpose. However, I believe the picture is changing very soon, cause there are huge needs for spatial analysis and planning in China, and it’s same to other developing countries.
The advantage of web GIS and mapping I could think about, would be:
  1. Sharing and presenting spatial analysis products could get immediate feedback from users, this is first thing make web GIS a big thing in the future. It’s all about how users feel and like it. From user/costumers preference on different function of the maps, the dives they use for the map, the engineer and analyst behind the service could improve the products largely;
  2. Much easier to share data and results,  and as a geospatial analyst, who could also access, analyze and edit the geo datasets whenever and wherever  they have internet;
  3. More and more open source spatial data are available online, and it’s became very powerful and easy to use online GIS analyzing tools, e.g. ArcGIS Online, GeoNetwork for the analysis;
  4. Online mapping tools could be used to make much appealing maps. If you are a heavy user of ArcGIS desktop, you would know how painful when your calculation could not be done because of some minor issues, and how much space the ArcGIS desktop takes up your PC and lap top. If you’re not have a cartography background or not that familiar with map displaying, your map products could end up looking like an disaster, which is my own experiences;
  5. Geospatial community is more like a open and sharing community, and there are already lot of geo experts engaged in providing free open sources and also expertise in a humanitarian crisis. For example, there are a huge group of volunteers from around the world rapidly digitized satellite images, maps and data to support humanitarian organizations got to rescue local people in the 2015 earthquake in Nepal.
  6. Everyone could contribute to Web GIS and mapping service. You could sign up Open Street Map for digitizing your community, it is being heavily used in Nepal earthquake. Your feedback for any mapping APPs would help to improve the service. Flickr pictures link to google map, or other online map services.  Drone using is new thing and also contributing hugely to wildlife population monitoring, land-use changes, and I am not talking about someone who use drone to stalk other people here.
There are just my thoughts. I might be wrong in some parts, and if you have any advice on revising the content, or editing the language please let me know.
job accessible in newyork

Data visualization via ArcGIS: from data to information and my Geo-Cases 4 and 5

Spatial analysis through Geographic Information System is very powerful that allows us to dig out the pattern and the message behind the random look data we collected. Geospatial analyst believes that the information is there, and it’s just how we could find it out and visualize it.

ESRI ArcGIS provide several spatial statistics tools, e.g cluster,regression,geogarphic relationship. I am playing with datasets of two separate cases today. First case is mining the crime data of 2008 in Pittsburgh, PA; the second case is analyzing population at risk from earthquakes in California city. The data-sets are provided by ESRI ArcGIS tutorial.

Knowledge needed: Geospatial statistics, mainly on buffering and cluster.

Geo-case 4 crime data mining from Pittsburgh, PA in 2008. The dataset I have here only have larcenies in Pittsburgh from 2008, the data included crime date, locations, the age, gender, race. To map out the larceny frequency for each neighborhood, and the criminal features are what I am going to present here. Group cluster analysis is used to dig out the pattern and message behind these random data.

Map results:

crime data mining in Pittburg-densityFrom the frequency/density of larcenies, there are more larcenies in some area especially the up right corner of the city. However, some areas are safer in term of larceny density, and have marked with a hollow fill.

crime data mining in Pittburgh1

Using group cluster analysis, six groups of larceny criminals are mapped on the map above. Each group contents race, gender and average age of the criminals.

Geo-case 5. Population at risk and number of death from earthquake since 1985.

Result map: Clifornia earthquak risk

Map interpretation: the points on the maps are the earthquakes distribution in California from 1720 to 1994. Only MMI higher than 6 were presented here. MMI,stands for Mercalli Intensity Scale, from 6 to 12 correspond to increasing damage, from considerable damage of poorly constructed buildings through total destruction (https://en.wikipedia.org/wiki/Mercalli_intensity_scale). Only death from the earthquakes since 1985 were counted. 440 death and 70% of them are from a earthquake in southern California in 1992. The circles on the map are the areas that significantly impacts by the earthquakes since 1985, and the number labeled are the death.

** data presented here might be modified and uncorrected, and I DON’T TAKE RESPONSIBILITY for the correctness of the information presented here. They are JUST the practice and assignments I’ve done for the professional certification test on ESRI ArcGIS 10.2. Please don’t use THE maps for any other purposes. 

**************************************************************************

*** I have a legal work permit in the states, and am now open for a job position in Geospatial Analyst/GIS Analyst around DC area (or telecommuting). I have knowledge on: 

  • Utilize advanced modeling techniques
  • Apply fundamental spatial statistics
  • Perform advanced vector and raster analysis
  • Perform surface modeling and analysis
  • Understand and apply python scripting
  • Perform fundamentals of spatial database design
  • Determine and define an appropriate coordinate system
  • Demonstrate proficiency in application configuration
  • Apply advanced visualization techniques
  • Understand fundamental network analysis concepts
  • Perform some basic network analysis

I mainly using ESRI ArcGIS 10.2, ArcGIS online, server, and have experience using open GIS softwares and platforms on QGIS and GRASS, and spatial modeling scripting via R and Python. I will present the knowledge above in the  geo-cases I’m doing in my future blogs. English is my third language, and any comments, proof reading, and advice on language polishing and even the content revision are welcomed.

Everything is spatial and they all can be mapped and my Geo-Case 3.

I majored in Geography for my bachelor degree and did Ecological Economics for my PhD. I often got questions from people asking if I am more an economist or an ecologist, I would say I am more a geographer.  “Oh, I never knew Geography is a major” or “what is that?” If you ever asked me these kind of question, please don’t feel bad about it, because you’re not the only one, and I bet my peers got these questions and response all the time.

One thing you might not know is Geospatial Technology has been listed as the top emerging industry in next decades by United States Department of Labor. To me Geospatial Technology is a combination of art, science and engineering. It’s the art of data visualization, and the thought and skills the analyst/cartographer put behind it. I usually got question about what is my ideal job from friends and family, I would say it’s probably Geographic Information System (GIS) analyst or geospatial analyst within the Geospatial Technology since I moved to the states . It’s difficult to become a good GIS analyst in China, even though China got a huge group of GIS analysts and good Geo-programers because it’s more difficult to access to geo-data there, and the field develops just recently and the fundamental data sources are so limited. You have to work for top research institutes or universities to be able to get the data to do further geospatial analysis, and of course you have to build up the network with the state agents first to be able to have the access to the data. However, the story is so different in the states that you have so much open source database run by the state department, and the people are so willing to share their data, the analysis. I got too excited I guess lol and decide to be one of them….This is a link to more than 300 free GIS datasets shared by Prof. Robin Wilson: http://freegisdata.rtwilson.com. Of course, like you’ve just guessed most of free datasets are run and shared by the research institutes, NGO, state lab and universities in the states.

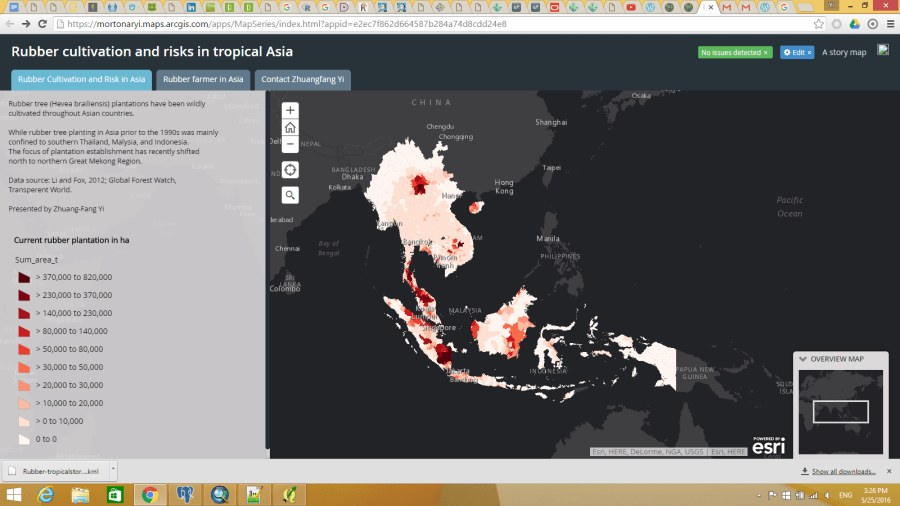
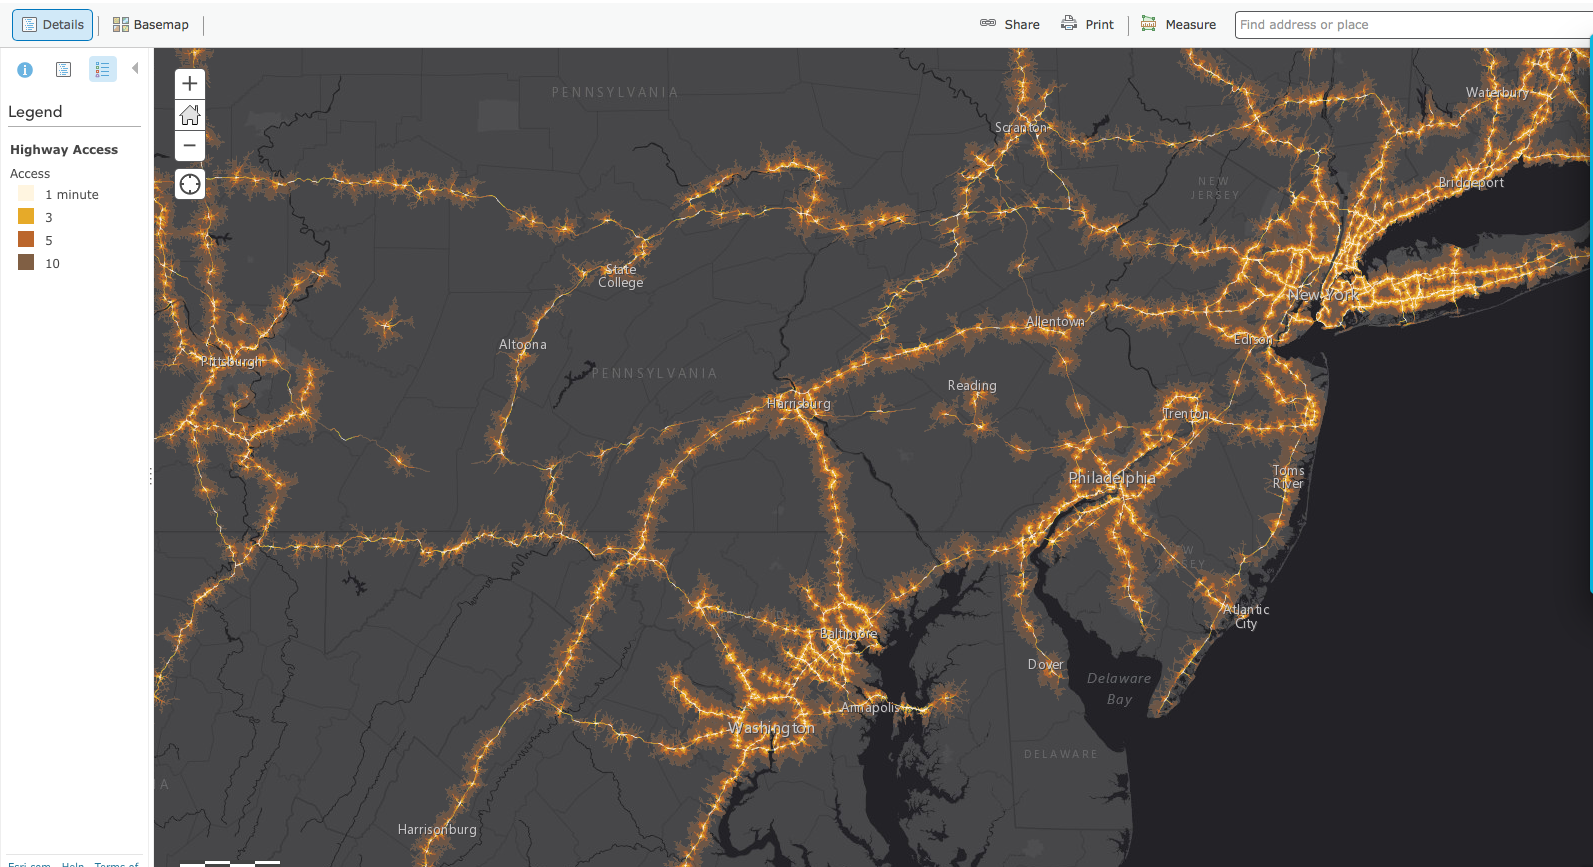
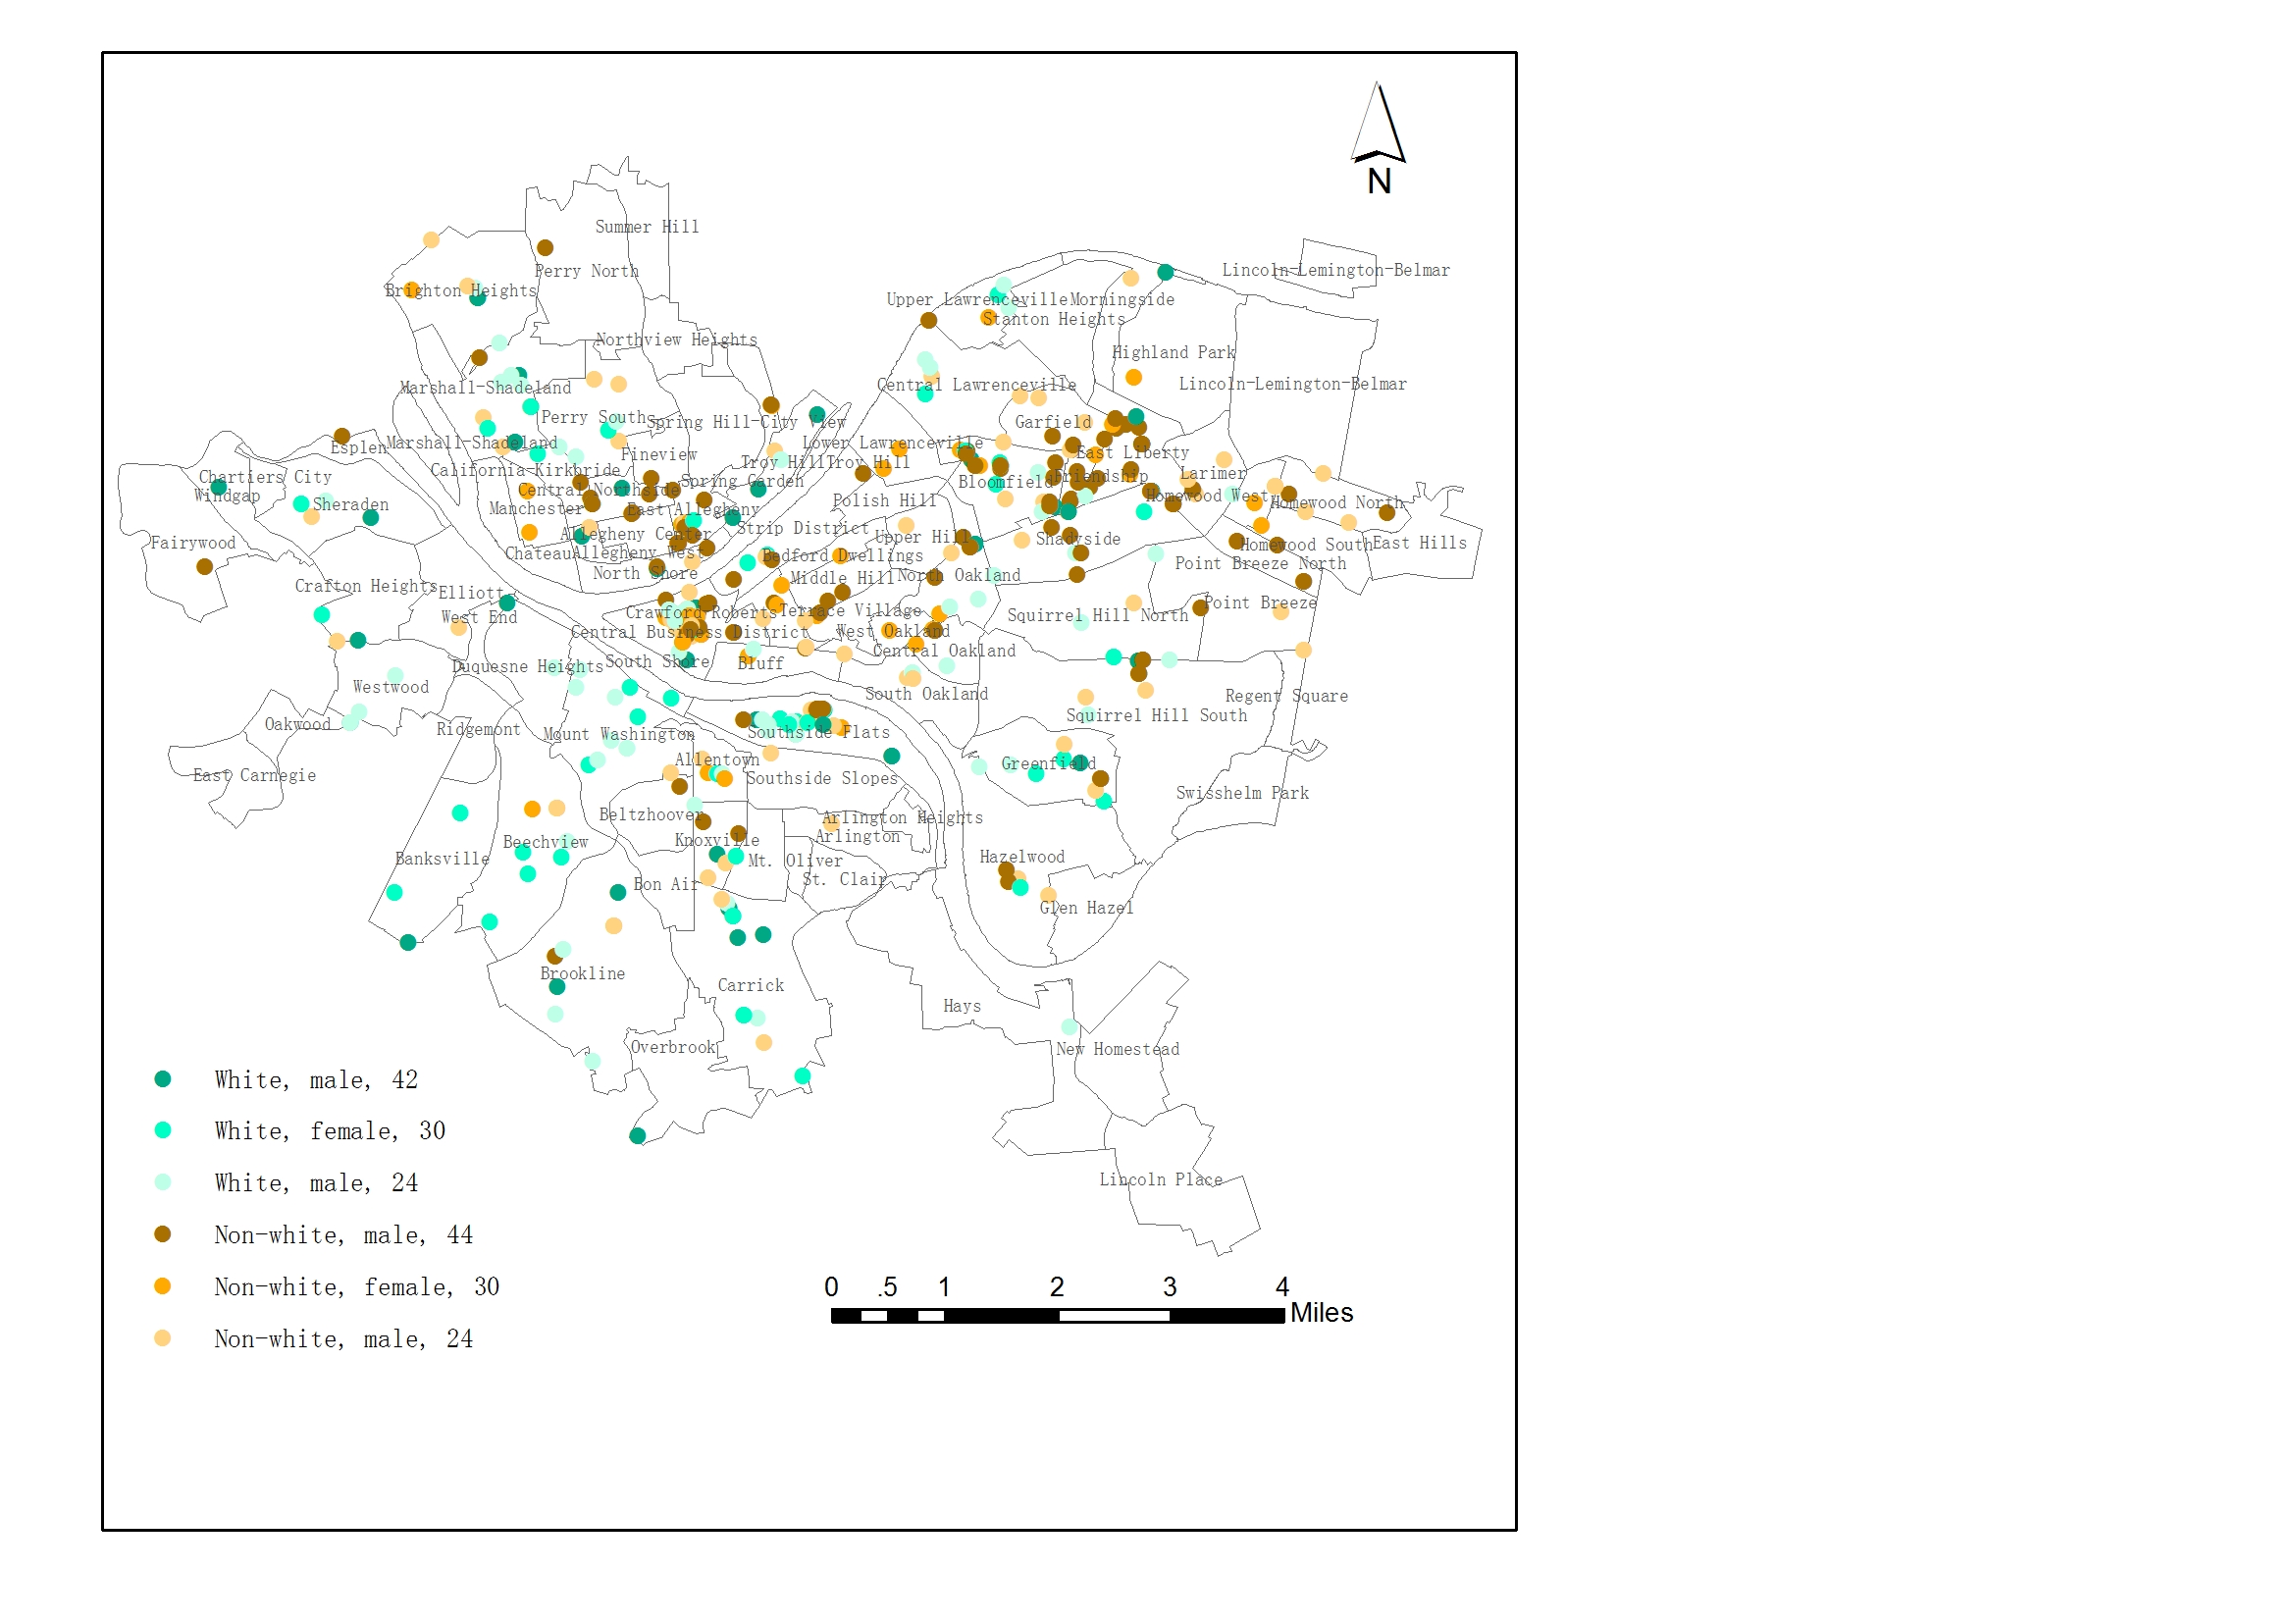
You’re probably would ask about ‘what is exactly geospatial technology?’ I would say they are just the maps you’re using every day, for example, the fastest or least traffic driving routs that google map tells you to get to airport; the map of the best Thai/Mediterranean/Mexican restaurants Yelp shows you; The price of housing around your neighborhood that your real estate agent tells you; or how about the crime map for police station in your area, some area attracts more serious crimes and some are low. Actually, you only need a very basic mapping skill with good platform to map these data that I mentioned above. Of course, you could do more sophisticated analysis with the geo-datasets you have access to, e.g. the medicare spending in some states (countries) are higher than others? Is that because they have less accessibility to good and clean water/food? Or there are just more health facilities happen to be there? Do people become healthier  after they spend more on the medicare and health? Or how about having a protected area in this location and why not a thousand miles away? How much we need to spend on protecting this wildlife? And where would be the most cost-efficient way to fund it?

Everything is spatial and they all can be mapped. Map is so powerful that you definitely could tell the story from the data presents on it. Even though a lot of data is open in the states, but to become a GIS analyst, who works for states department, needs to have a security clearance. It becomes impossible for a non us citizen then. It’s such a dilemma, right? However, there are already such a good and open data source in the states, and I’ve seen so many cool analysis have been presented. Therefore, the work ethics have been highly valued in the field, including what message you’re presenting in the maps and who you present to.

Back to my Geo-Case 3, I had an experience to work with a national nature reserve (state protected area) in China this July. I tried to quantify the habitat quality for future biodiversity conservation under human disturbance and climate change, and to target a location for avoid the impacts from both human disturbance and climate change. We’ve been working with the natural reserve for years and have able to road network, villages location, socioeconomic and demographic data, and historical land-use maps, soil map, vegetation type and so on. My colleagues in World Agroforestry Centre run climate change models, and they impacts on land-use change, which were the land-use change simulation rule for me to run the land-use scenarios.

Data description:  To run this geospatial model of wildlife habitat degradation under human disturbance would need the land- use maps in recent years, climate change data, soil, vegetation type, socioeconomic and demographic and so on. I run the habitat degradation models though InVest (you could get more information through here: http://www.naturalcapitalproject.org). It a platform that allow you to value natural capital.

Knowledge need: remote sensing imagery processing for the land-use mapping; Geo-statistics/geospatial through ESRI ArcGIS; InVest, especially, habitat quality and habitat risk management. (Leave me a comment if you need more detail information).

Result maps:

land-use

hibitat degredation

No surprise that human disturbance have more impacts on habitat quality in the nature reserve, which you could tell the degraded areas are along the road network; and the core area for the nature reserve, which has the least human disturbance, would maintain the highest habitat quality (yellow corner on the left corner of the map.).

*** I am now open for a job position in Geospatial Analyst/GIS Analyst around DC area (or telecommuting). I have knowledge on: 

  • Utilize advanced modeling techniques
  • Apply fundamental spatial statistics
  • Perform advanced vector and raster analysis
  • Perform surface modeling and analysis
  • Understand and apply python scripting
  • Perform fundamentals of spatial database design
  • Determine and define an appropriate coordinate system
  • Demonstrate proficiency in application configuration
  • Apply advanced visualization techniques
  • Understand fundamental network analysis concepts
  • Perform some basic network analysis

I mainly using ESRI ArcGIS 10.2,  ArcGIS online, server, and have experience using open GIS softwares and platforms on QGIS and GRASS, and spatial modeling scripting via R and Python. I will present the knowledge above in the  geo-cases I’m doing in my future blogs. English is my third language, and any comments, proof reading, and advice on language polishing and even the content revision are welcomed.

Geo-Case 2: analyzing a household hazardous waste participant for a NGO

Case description: The Pennsylvania Resources Council (PRC) is a non-profit organization (NGO) that into environmental protection. Recently, PRC is helping homeowners in many counties in Pennsylvania collecting and disposing of common household products such as paint, solvents, automotive fluids, pesticides, insecticides, and cleaning chemicals, which could not recycling easily. To better develop education and outreach materials response to their work,they want to map out the participants who are volunteering for the program.

Geospatial skill needed: Geocoding.

Data: In this study, only zipcode of the household participants have been recorded. 

Result: the location

Geocode household hazardous waste

In this case study, only participants around Allegheny county are presented. The result shows that more people who can access to PRC are more willing need to participant the program at this point. 

I would try to write more blogs here. The purposes are:

  1. wanna get better on writing in English;
  2. trying to sale my Geospatial analysis skill to the potential employers and customers;
  3. Put up the geospatial cases I’ve done and passion about, and would help me to build my own GEO case file in the future.

I am doing case study instead of putting up the programming,coding and mapping skill, because I believe that mapping is a kinda art and you won’t really interested in how I made them.If you are interesting in these skills, you could contact me for lectures, mapping and analysis work through: yi.zhuangfang@gmail.com. Any language editing, case presenting and map cartography comments are welcomed.

Geo-Case 1: how to promote your art activities for the potential market of your company

(In my blog, I will use a lot of abbreviation, one of the most frequent ones would be GIS, which stands for Geographic Information System)

GIS knowledge needed: Geocoding;

Data source: Pennsylvania (GIS Tutorial BOOK 1)

Analysis purpose:  There is an art event sponsored by an arts’ organization in Allison Park, Pittsburgh, called FLUX. The event planners of FLUX would like to know where the event attendees reside for planning and marketing activities in the future. There are only attendees’ ZIP codes have been recorded. So simply, we are going to produce a map for FLUX by using ZIP code that attendees provided to tell where they are from in the area.

Data summery: 1487 attendees, and about 86% of them are from Pennsylvania;

Map result:

Tutorial8-1

Conclusion: FLUX needs more planning and marketing for Pittsburgh, especially the southeast corner, since there are more attendee from that area, and they could be the main customers for the future art events marketing who drove far up to north for the art event. However, there are always more information could be visualized, for example, the age, occupation and so on!