
Spatial analysis through Geographic Information System is very powerful that allows us to dig out the pattern and the message behind the random look data we collected. Geospatial analyst believes that the information is there, and it’s just how we could find it out and visualize it.
ESRI ArcGIS provide several spatial statistics tools, e.g cluster,regression,geogarphic relationship. I am playing with datasets of two separate cases today. First case is mining the crime data of 2008 in Pittsburgh, PA; the second case is analyzing population at risk from earthquakes in California city. The data-sets are provided by ESRI ArcGIS tutorial.
Knowledge needed: Geospatial statistics, mainly on buffering and cluster.
Geo-case 4 crime data mining from Pittsburgh, PA in 2008. The dataset I have here only have larcenies in Pittsburgh from 2008, the data included crime date, locations, the age, gender, race. To map out the larceny frequency for each neighborhood, and the criminal features are what I am going to present here. Group cluster analysis is used to dig out the pattern and message behind these random data.
Map results:
 From the frequency/density of larcenies, there are more larcenies in some area especially the up right corner of the city. However, some areas are safer in term of larceny density, and have marked with a hollow fill.
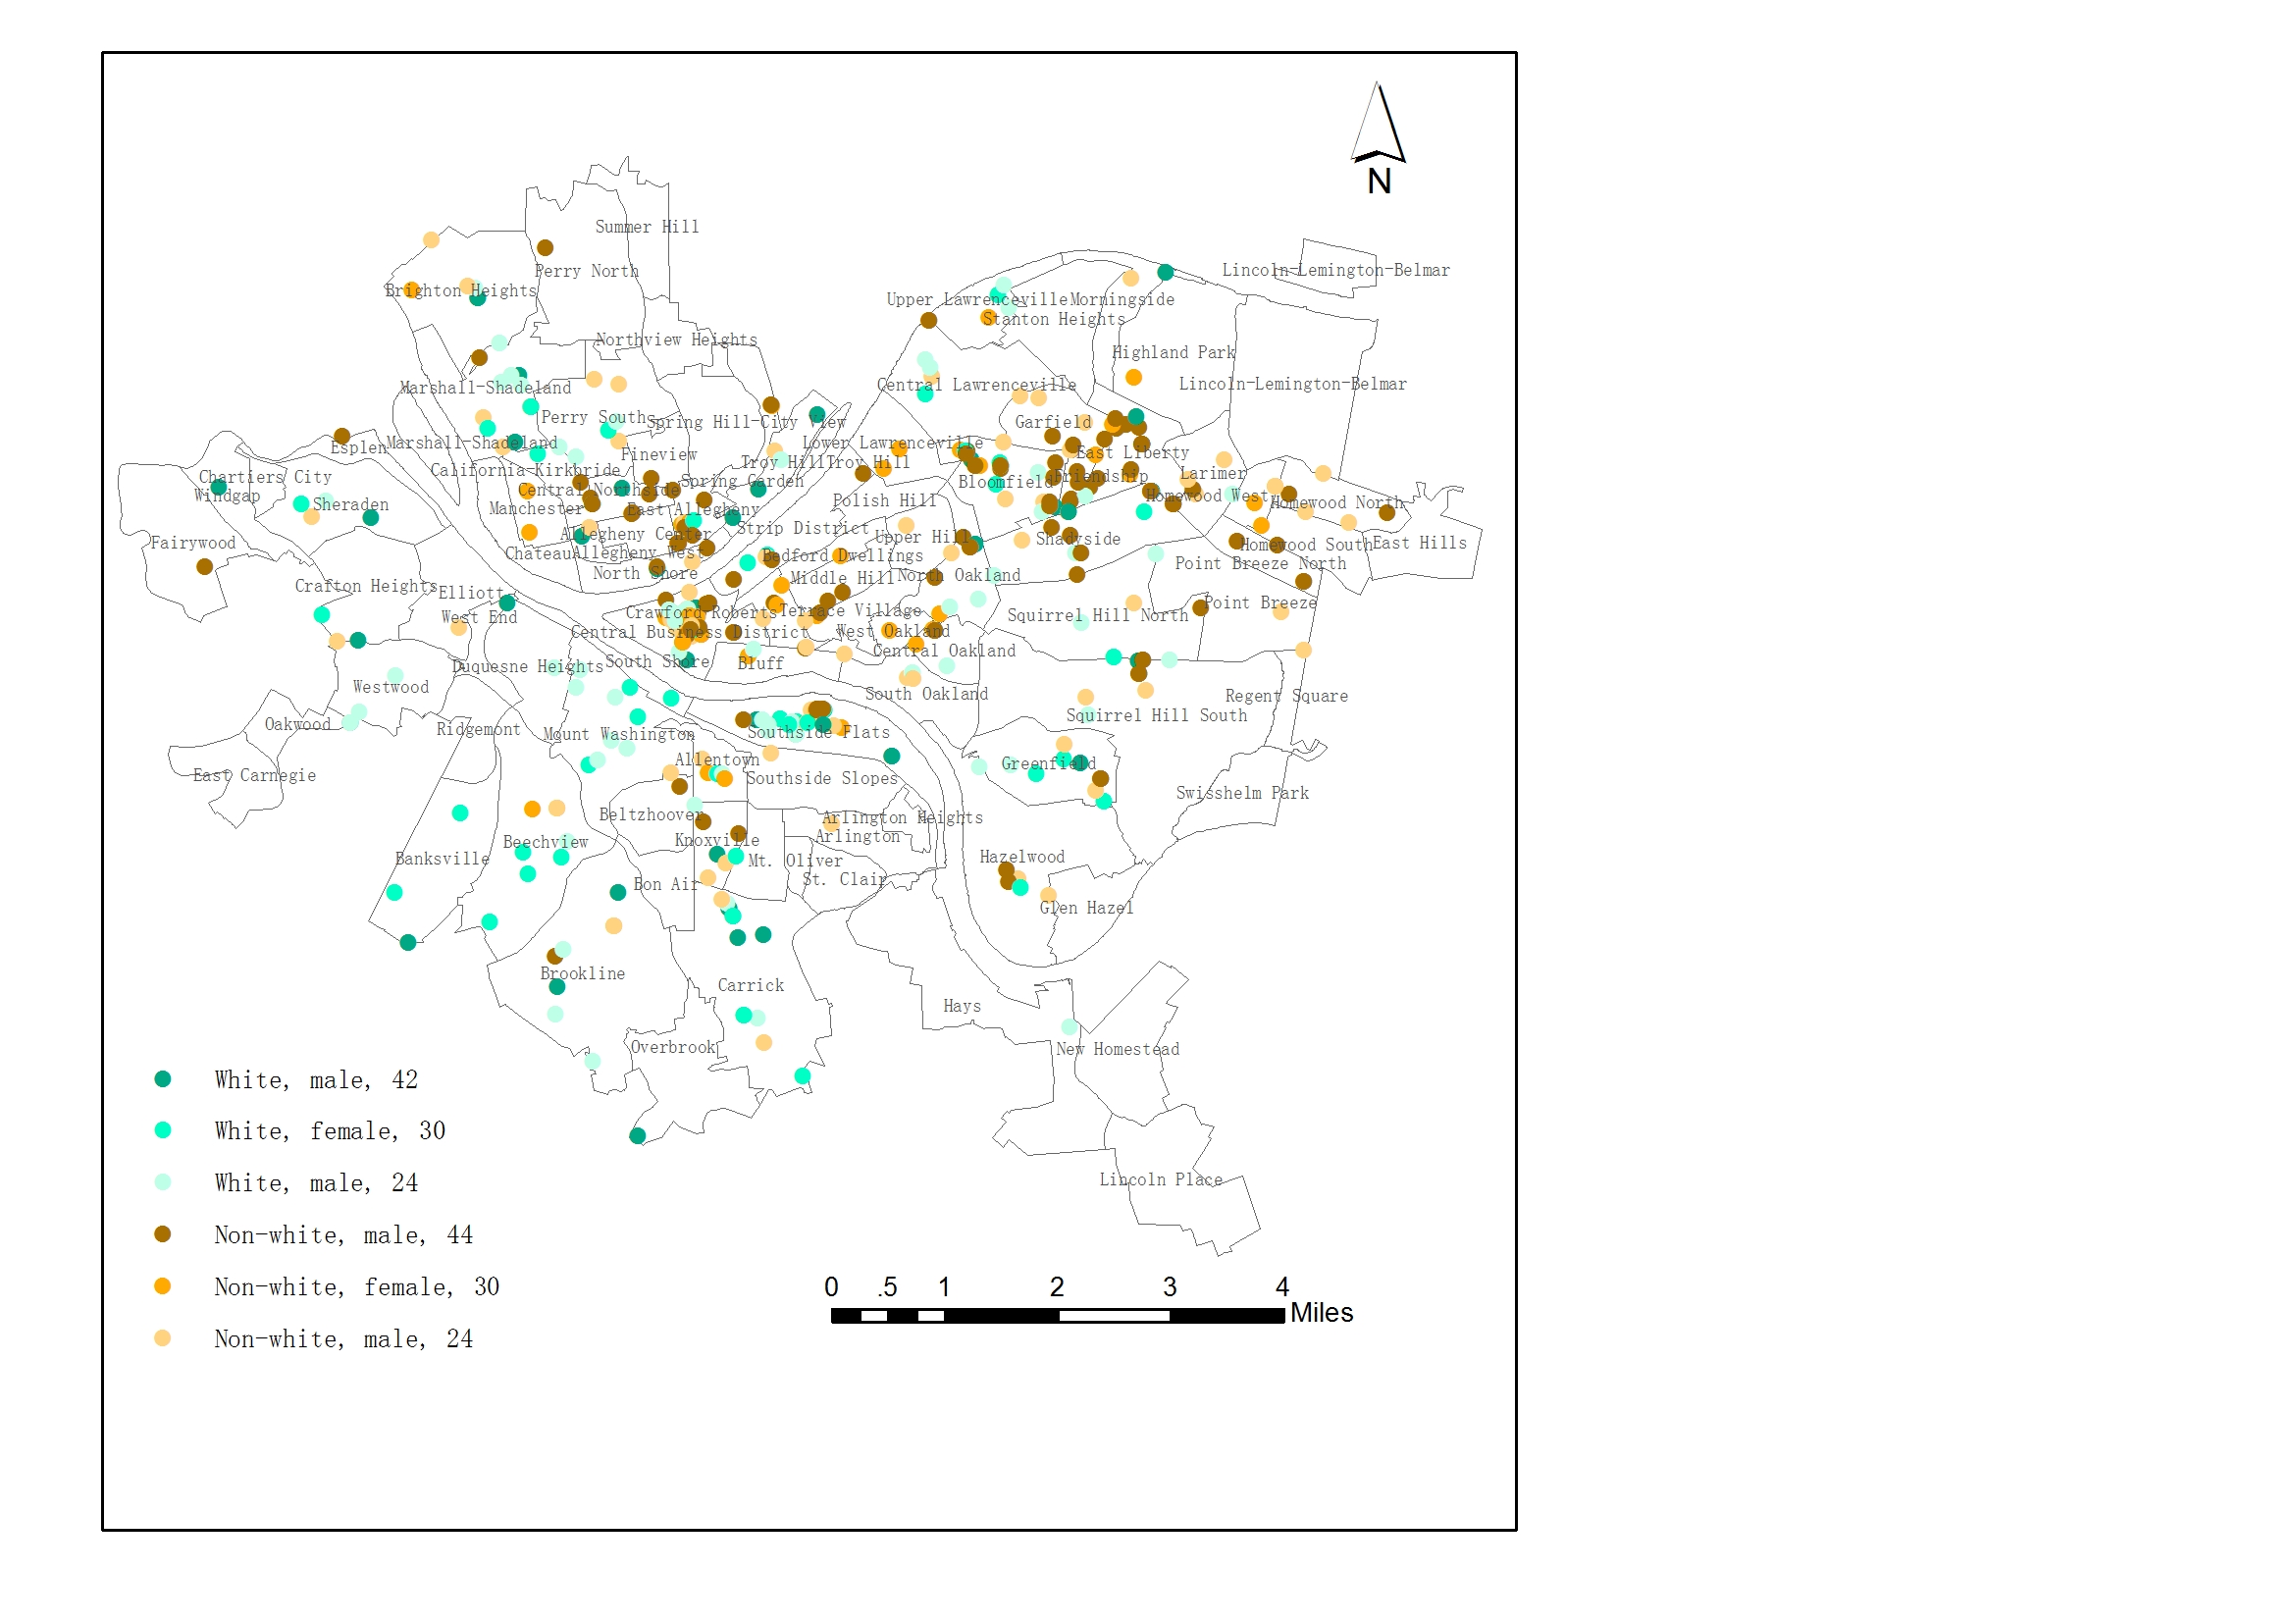
Using group cluster analysis, six groups of larceny criminals are mapped on the map above. Each group contents race, gender and average age of the criminals.
Geo-case 5. Population at risk and number of death from earthquake since 1985.
Result map: 
Map interpretation: the points on the maps are the earthquakes distribution in California from 1720 to 1994. Only MMI higher than 6 were presented here. MMI,stands for Mercalli Intensity Scale, from 6 to 12 correspond to increasing damage, from considerable damage of poorly constructed buildings through total destruction (https://en.wikipedia.org/wiki/Mercalli_intensity_scale). Only death from the earthquakes since 1985 were counted. 440 death and 70% of them are from a earthquake in southern California in 1992. The circles on the map are the areas that significantly impacts by the earthquakes since 1985, and the number labeled are the death.
** data presented here might be modified and uncorrected, and I DON’T TAKE RESPONSIBILITY for the correctness of the information presented here. They are JUST the practice and assignments I’ve done for the professional certification test on ESRI ArcGIS 10.2. Please don’t use THE maps for any other purposes.
**************************************************************************
*** I have a legal work permit in the states, and am now open for a job position in Geospatial Analyst/GIS Analyst around DC area (or telecommuting). I have knowledge on:
- Utilize advanced modeling techniques
- Apply fundamental spatial statistics
- Perform advanced vector and raster analysis
- Perform surface modeling and analysis
- Understand and apply python scripting
- Perform fundamentals of spatial database design
- Determine and define an appropriate coordinate system
- Demonstrate proficiency in application configuration
- Apply advanced visualization techniques
- Understand fundamental network analysis concepts
- Perform some basic network analysis
I mainly using ESRI ArcGIS 10.2, ArcGIS online, server, and have experience using open GIS softwares and platforms on QGIS and GRASS, and spatial modeling scripting via R and Python. I will present the knowledge above in the geo-cases I’m doing in my future blogs. English is my third language, and any comments, proof reading, and advice on language polishing and even the content revision are welcomed.
